官网的步骤如下: https://go-zero.dev/docs/tutorials/monitor/index
健康检查
Name: user-api
Host: 0.0.0.0
Port: 8002

DevServer:
    Enabled: true
    Port: 6470
    HealthPath: "/healthz"
健康检查默认端口为
6470,默认Path为/healthz
可以用阿里云的云拨测或者类似的功能, 定时请求这个接口, 确保服务正常运行
日志收集
- 日志可以直接写到标准输出, 然后通过类似的 sls 服务聚合到一起
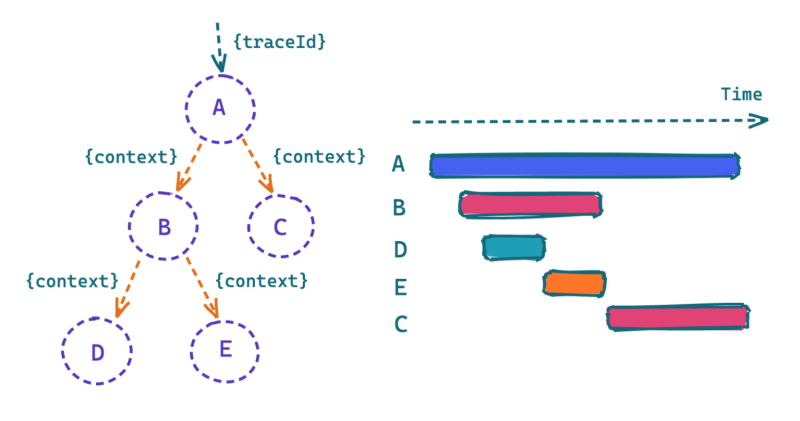
链路追踪
-
接入阿里云的 https://arms.console.aliyun.com/
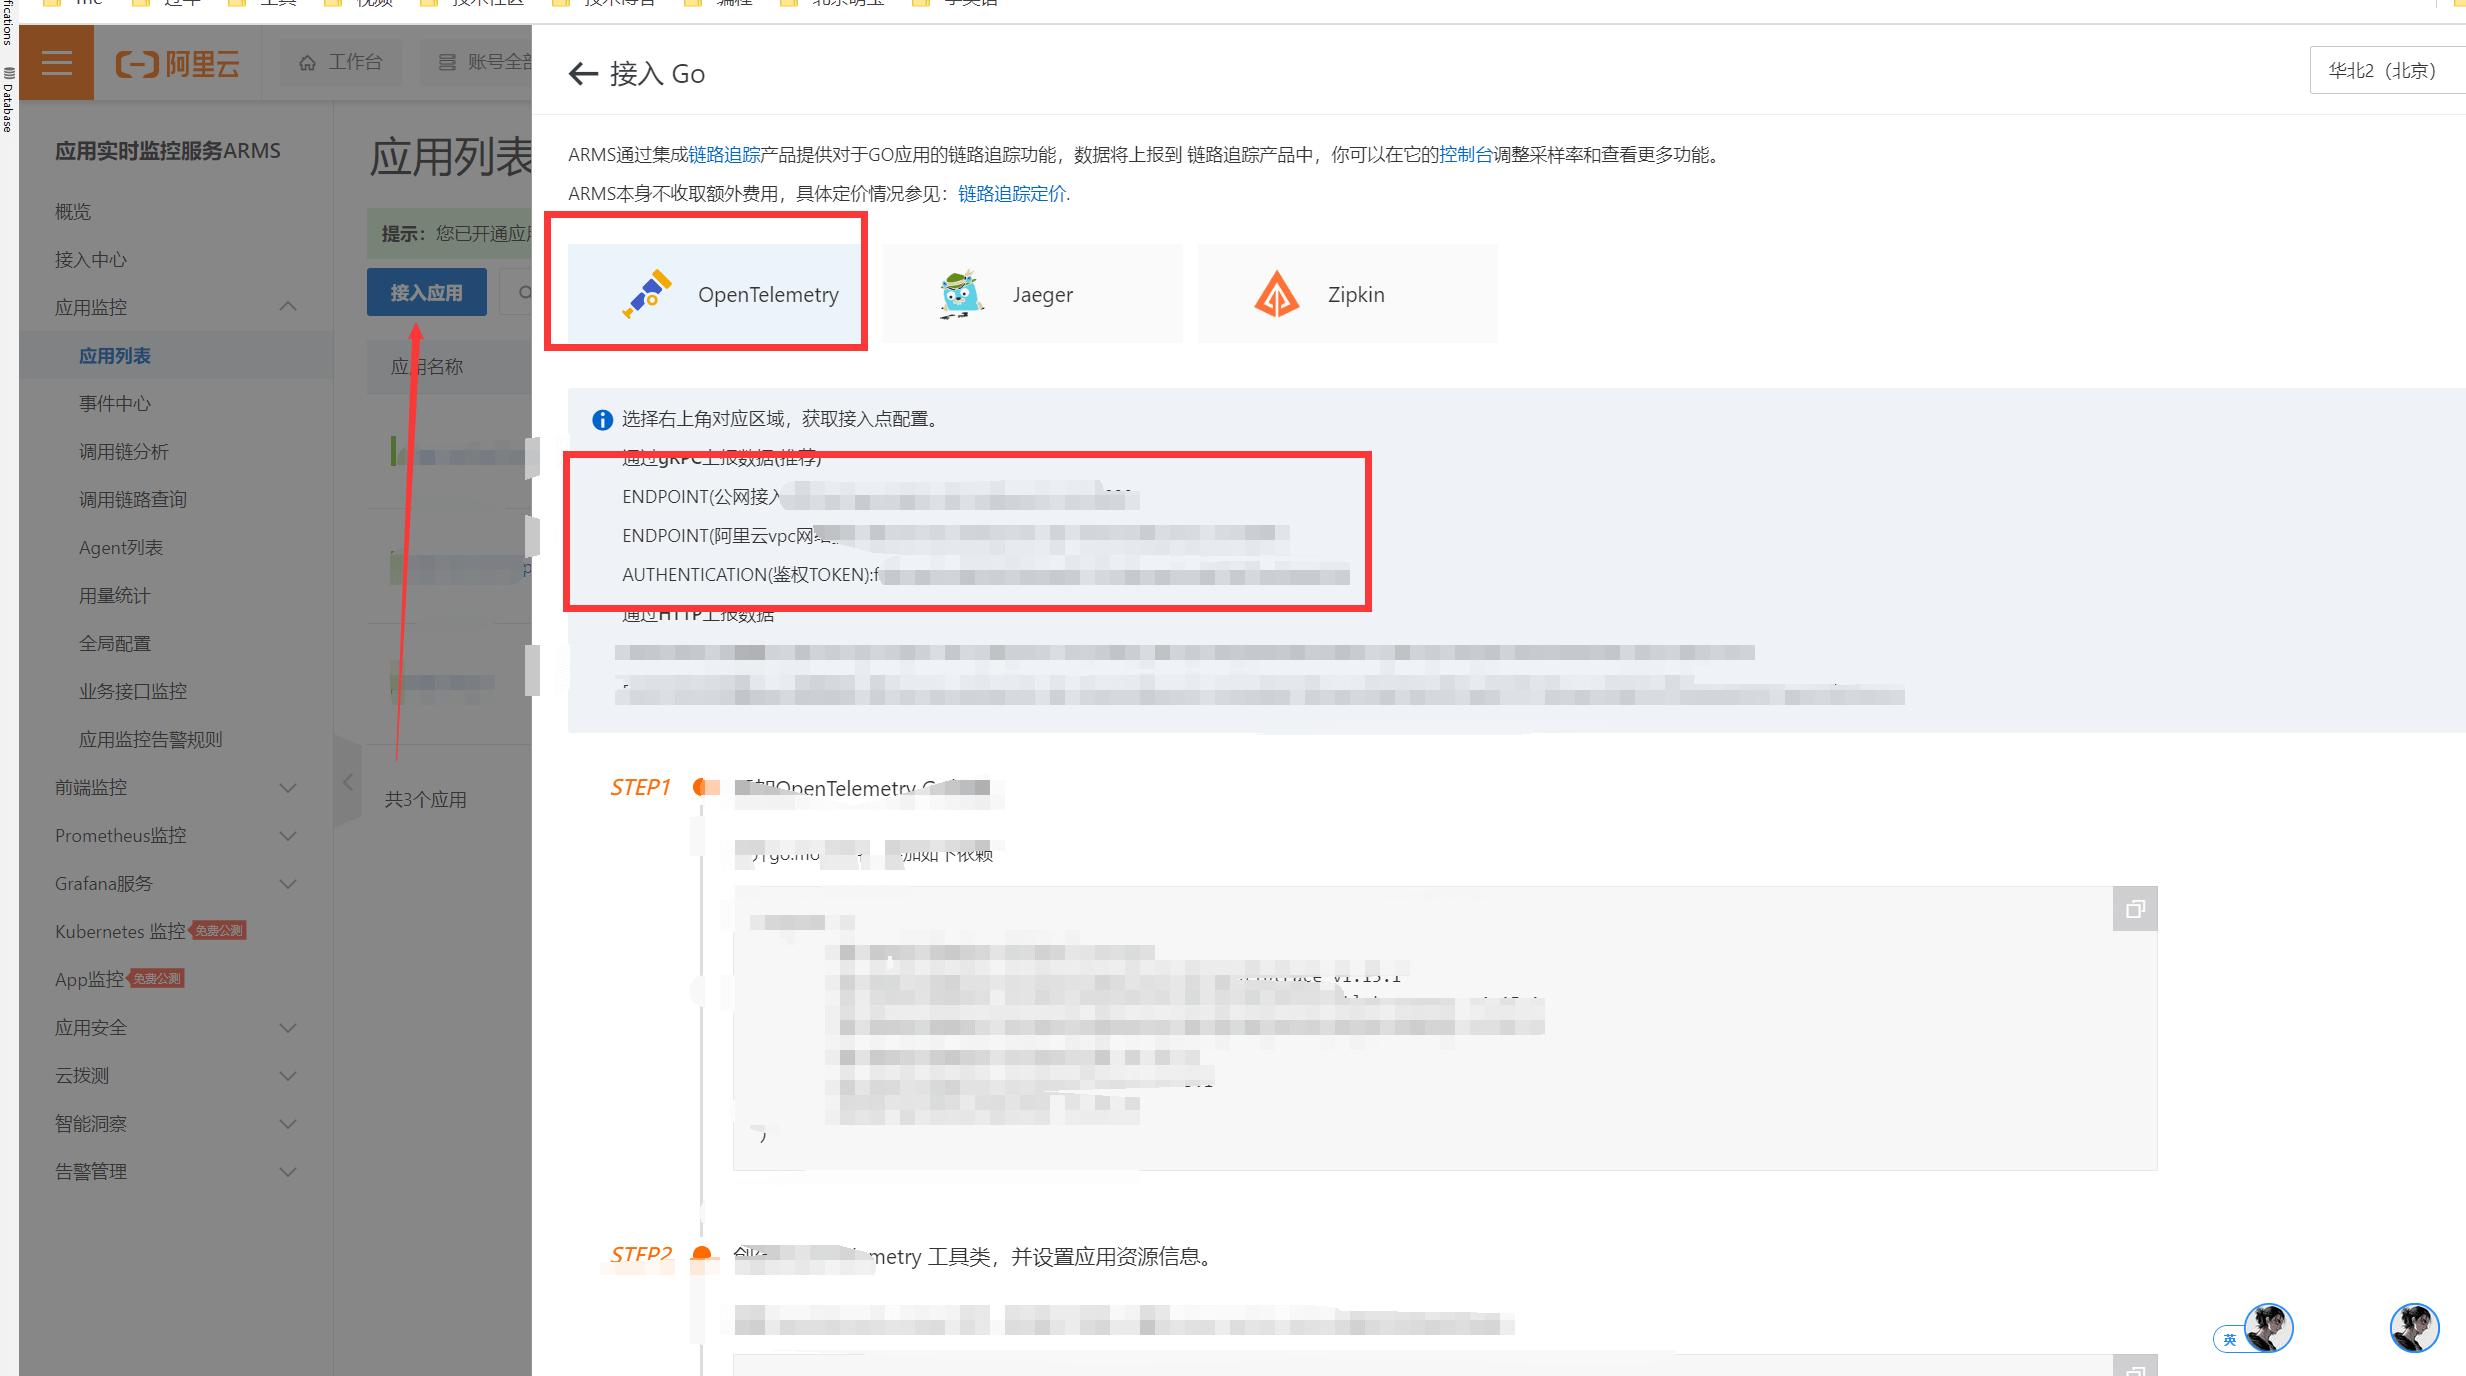
1.png -
注意
go-zero的配置中Batcher不要选Jaeger:
Name: xxxx
# 链路追踪, 注意需要使用 otlgrpc, 因为其它上传方式不支持自定义 header
Telemetry:
  Name: xxxx
  Endpoint: 阿里云的endpoint
  Sampler: 1.0
  Batcher: otlpgrpc
  OtlpHeaders:
    Authentication: 阿里云的token
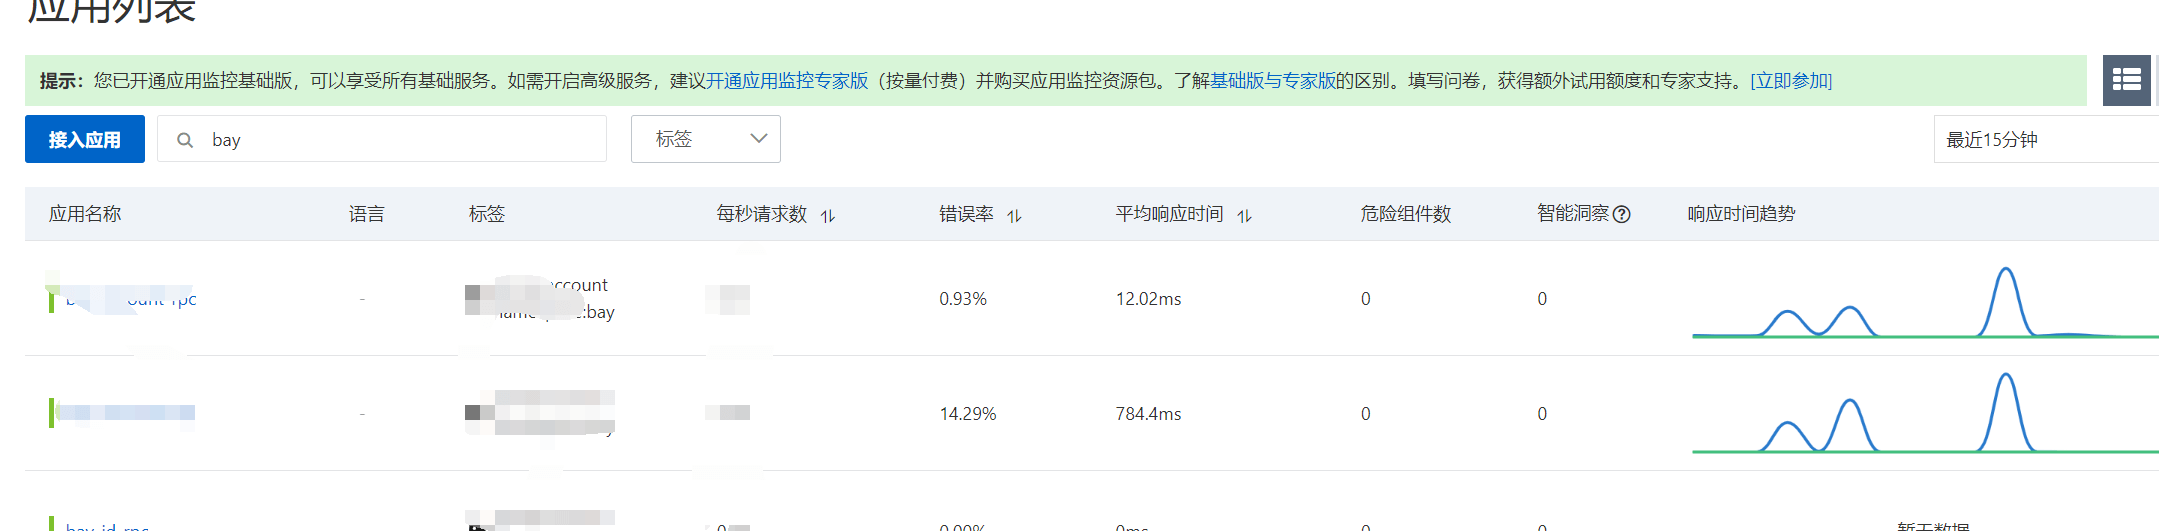
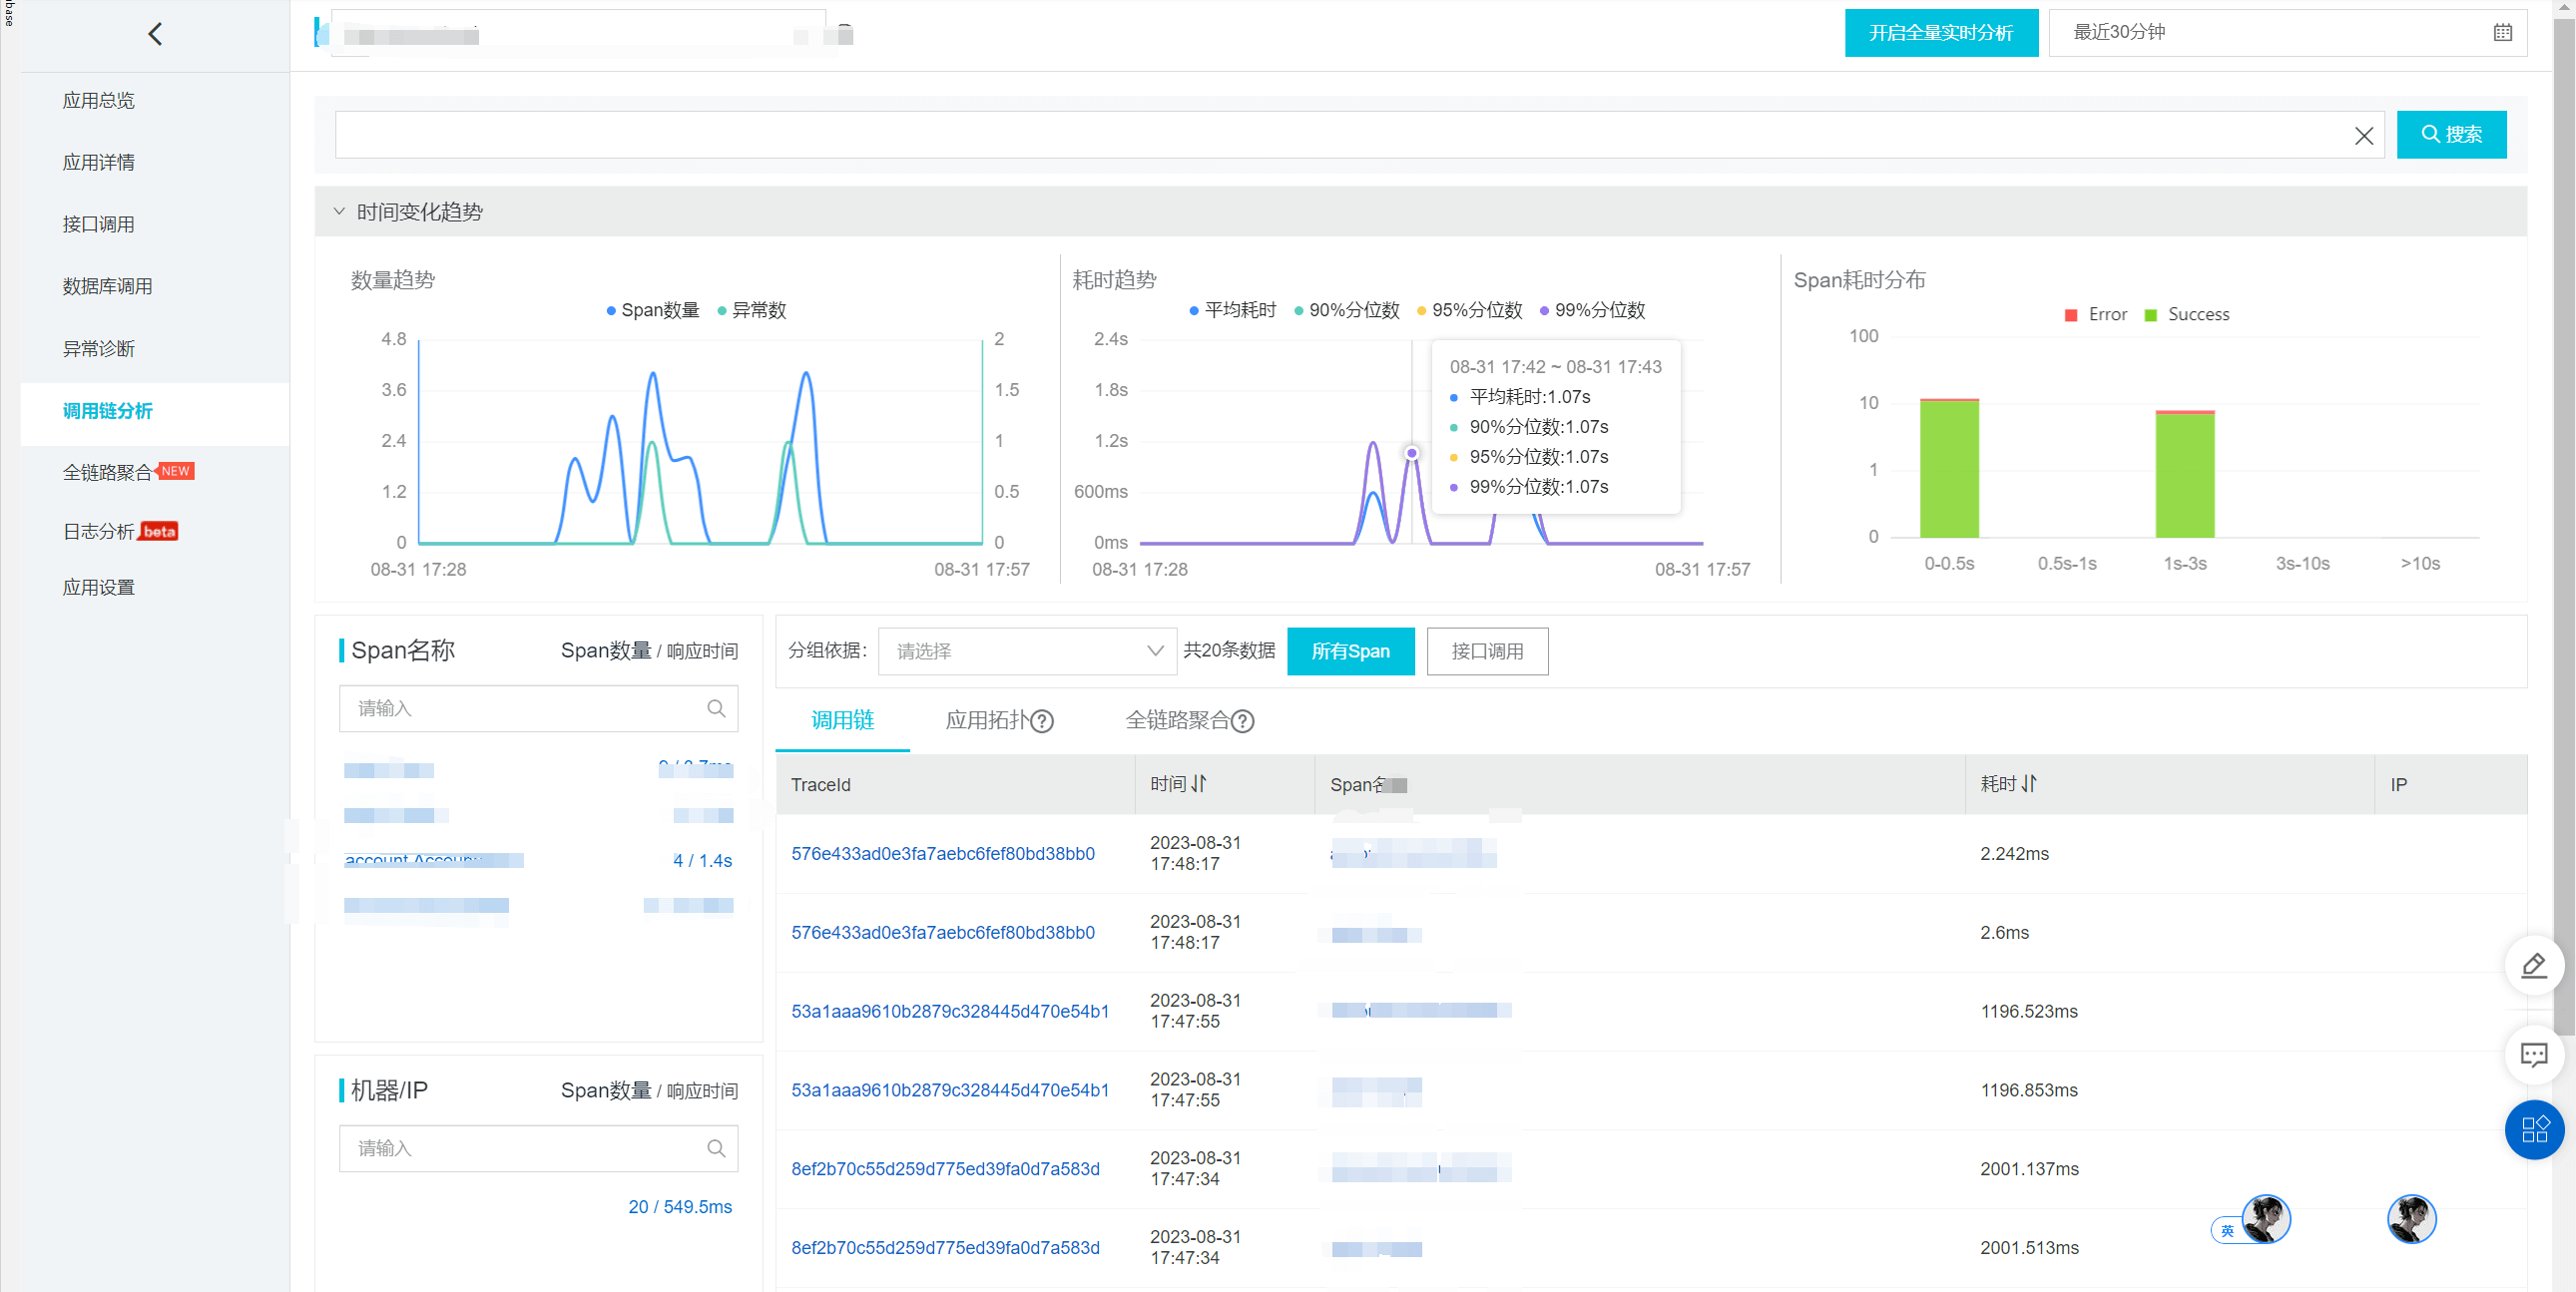
成品效果
指标监控
Name: user-api
Host: 0.0.0.0
Port: 8002

DevServer:
    Enabled: true
    Port: 6470
    MetricsPath:   "/metrics"
    EnableMetrics: true
- 然后就可以在
prometheus添加指标收集