
Installation
- Many online tutorials simply use a single Docker command:
docker run -it -p 4040:4040 --restart=always pyroscope/pyroscope:latest server - However, this basic installation lacks crucial configurations: no authentication for the data dashboard, no API reporting restrictions (e.g., limiting reporting via API keys), and no data persistence after container destruction.
- Here’s a better approach using
docker-compose.yml:
version: "3"
services:
  pyroscope:
    image: "pyroscope/pyroscope:latest"
    ports:
      - "4040:4040"
    command:
      - "server"
    environment:
      ## Enforce API key authentication for data ingestion
      - PYROSCOPE_AUTH_INGESTION_ENABLED=true
      ## Enable login for web dashboard
      - PYROSCOPE_AUTH_INTERNAL_ENABLED=true
    volumes:
      ## Persistent data storage
      - ./data:/var/lib/pyroscope
- After configuration, run
docker-compose up -dand access127.0.0.1:4040to see the login page. - Default credentials: admin/admin (change after initial login).
- Add API keys under Settings -> API Keys -> Add Key. Note: Select
Agentrole for data reporting permissions.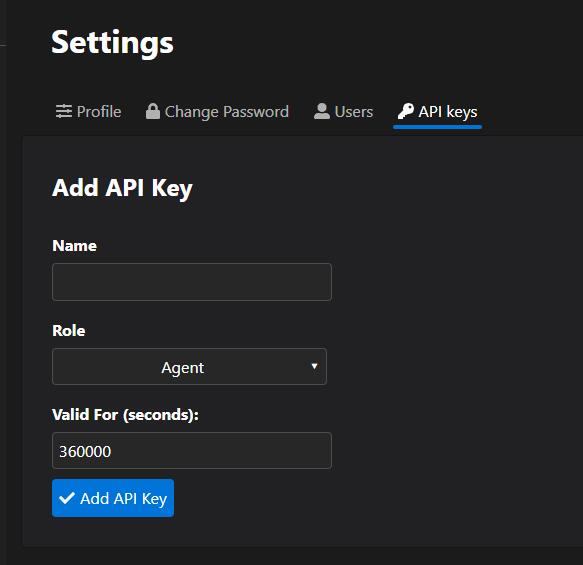
Pyroscope
Go Implementation
Go supports two modes: pull mode (like Prometheus) and push mode. For personal projects, push mode is recommended.
- Add dependency:
# Ensure pyroscope server version ≥0.3.1
go get github.com/pyroscope-io/client/pyroscope
- Initialize in code:
package main

import "github.com/pyroscope-io/client/pyroscope"

func main() {
    pyroscope.Start(pyroscope.Config{
        // Application name (must be in English, no Chinese characters)
        ApplicationName: "remeber-dream-api",
        ServerAddress:   "127.0.0.1:4040",
        Logger:          pyroscope.StandardLogger,
        // Required if PYROSCOPE_AUTH_INGESTION_ENABLED is enabled
        AuthToken:       "xxxx",

        // Select profiling types (default: all enabled)
        ProfileTypes: []pyroscope.ProfileType{
            pyroscope.ProfileCPU,
            pyroscope.ProfileAllocObjects,
            pyroscope.ProfileAllocSpace,
            pyroscope.ProfileInuseObjects,
            pyroscope.ProfileInuseSpace,
        },
    })

    // Your application logic
}
PHP Implementation
-
Native PHP profiling (via official docs) works best for CLI. For PHP-FPM, enable slow logs instead.
-
For Swoole-based projects like
laravel-s: -
Dockerfile example:
FROM phpswoole/swoole:php7.4

# Change to Chinese mirror source
RUN sed -i "s@http://deb.debian.org@http://mirrors.aliyun.com@g" /etc/apt/sources.list && rm -rf /var/lib/apt/lists/* && apt-get update

# Install PHP extensions
COPY --from=mlocati/php-extension-installer /usr/bin/install-php-extensions /usr/local/bin/
RUN install-php-extensions pcntl redis pdo_mysql gd

WORKDIR /var/www
COPY . .
RUN chmod -R 0777 storage && \
    chmod -R 0777 bootstrap/cache && \
    composer config -g repo.packagist composer https://mirrors.aliyun.com/composer/ && \
    composer install --optimize-autoloader --no-dev && \
    php artisan config:cache && \
    php artisan route:cache && \
    php artisan view:cache && \
    php artisan laravels publish --no-interaction

# Copy pyroscope binary from official image
COPY --from=pyroscope/pyroscope:latest /usr/bin/pyroscope /usr/bin/pyroscope

## Recommended to inject credentials via runtime environment
#ENV PYROSCOPE_SERVER_ADDRESS=
#ENV PYROSCOPE_APPLICATION_NAME=
#ENV PYROSCOPE_AUTH_TOKEN=

CMD ["pyroscope", "exec", "php", "bin/laravels", "start", "--env=production"]
Key Notes
- Avoid Alpine-based images (compatibility issues).
- Inject credentials via
docker run --envinstead of hardcoding in Dockerfile. - Use
pyroscope execbefore your main command as shown in docs. - Final result:
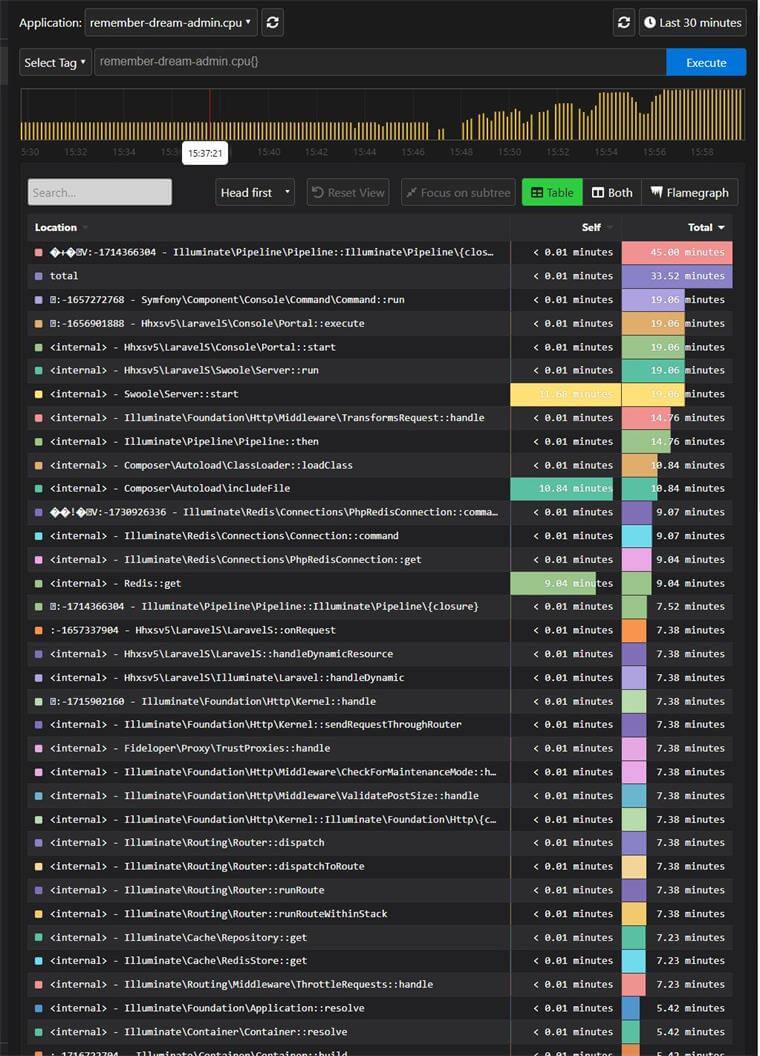
- For a cached API endpoint under load testing, most time is spent on route matching and Redis operations.
Metric Explanations
| Metric | Description |
|---|---|
| cpu | CPU usage |
| inuse_objects | Allocated but unreleased objects |
| alloc_objects | Total allocated objects (including released) |
| inuse_space | Allocated but unreleased memory |
| alloc_space | Total allocated memory (including freed) |