
I previously used ab (ApacheBench), the built-in stress testing tool from Apache, but found it less convenient. After some research, I discovered a tool called JMeter.
Installing JDK
Since JMeter is developed in Java, we need a Java Runtime Environment (JRE). For simplicity, we’ll install the full JDK (Java Development Kit):
- Visit the official Oracle download page:
https://www.oracle.com/technetwork/java/javase/downloads/index.html - Select JDK download:
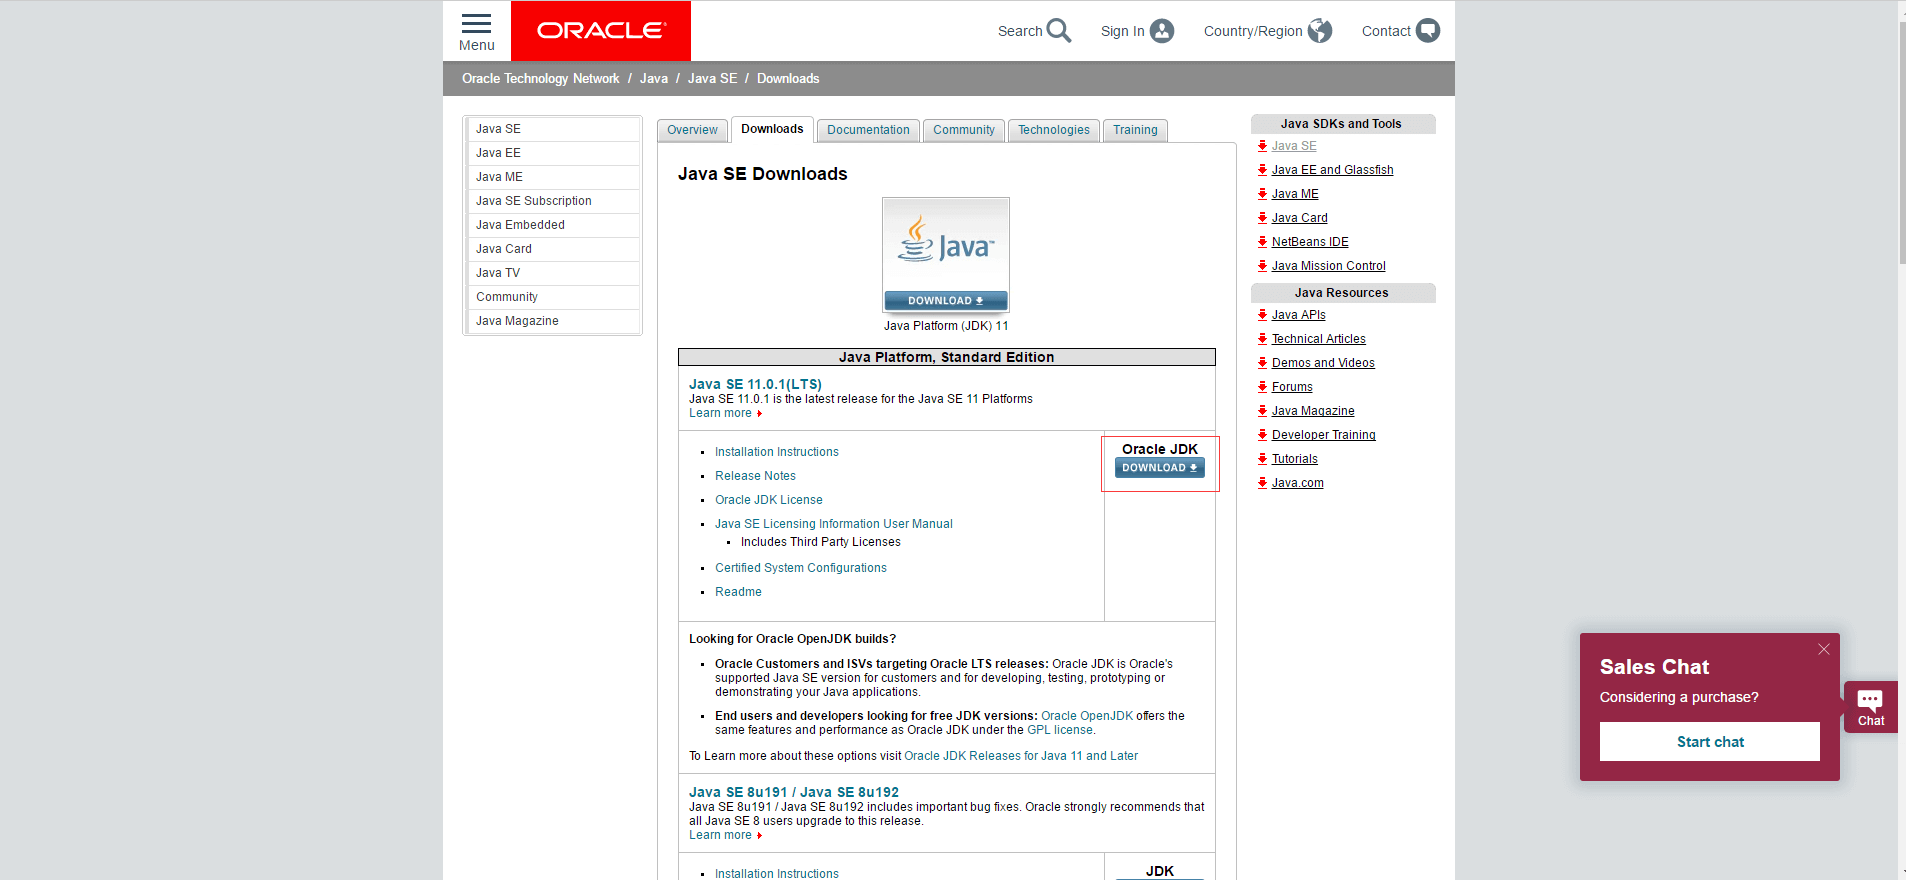
JDK Download - Accept the license agreement and download the appropriate version for your OS (Windows in this case):
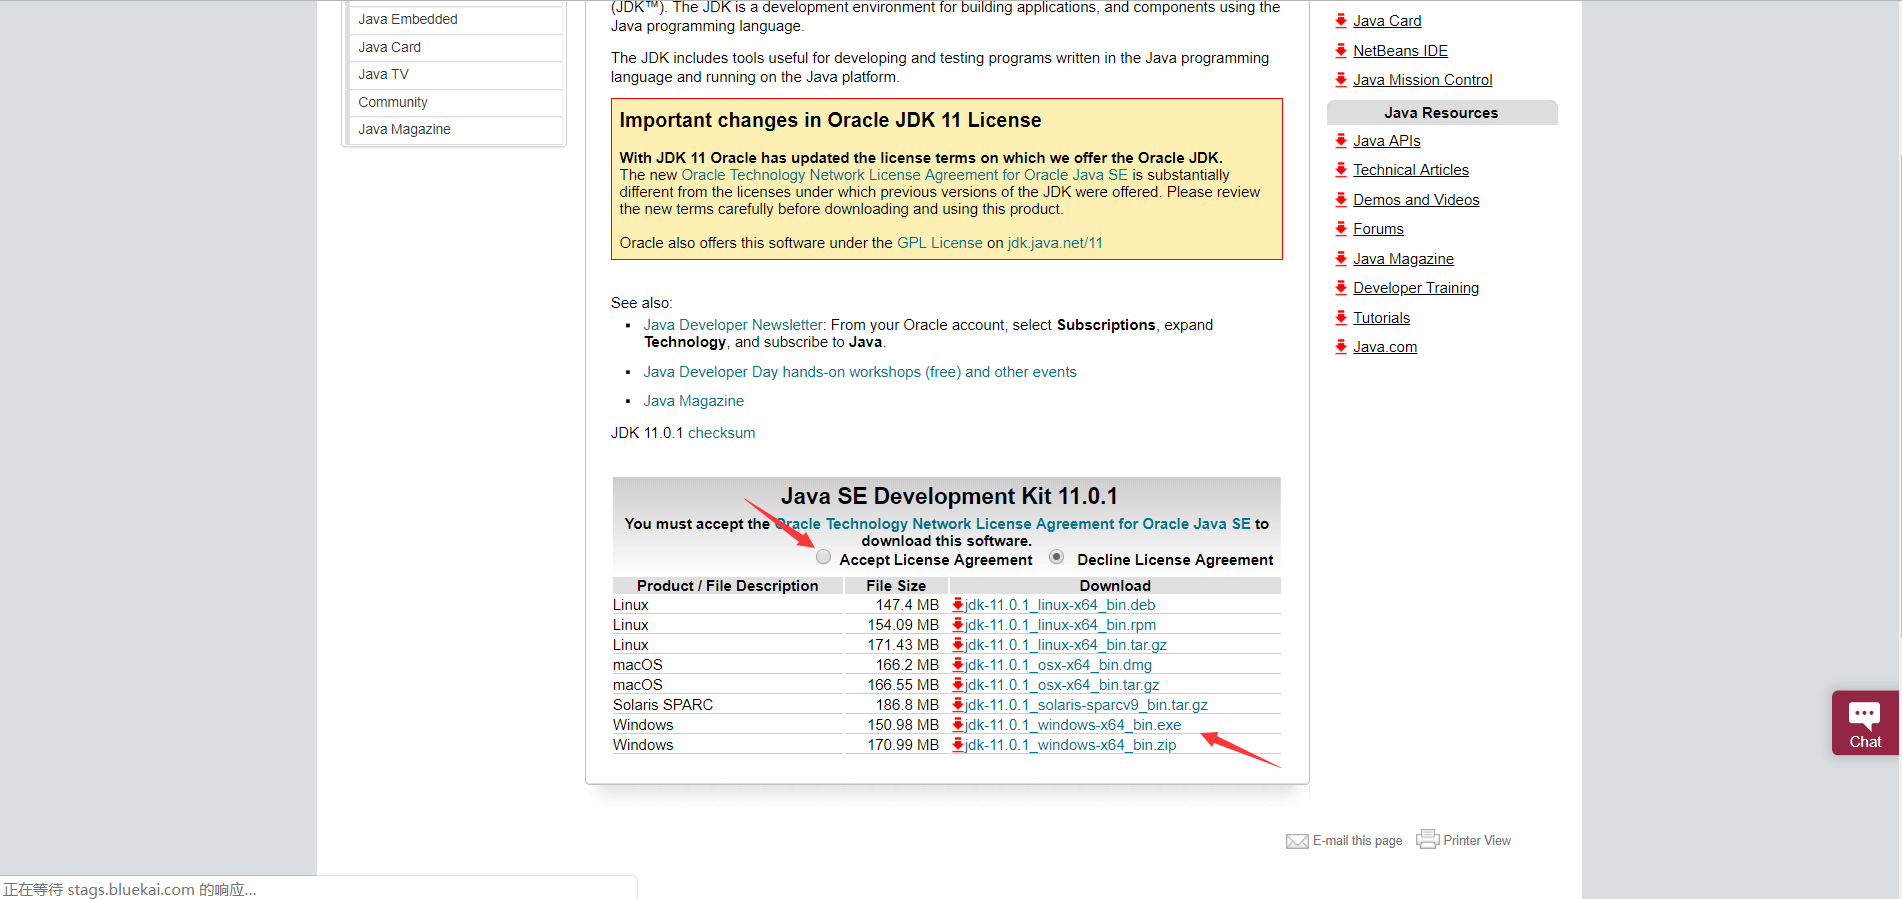
JDK Version - Run the installer with default settings (note the installation directory):
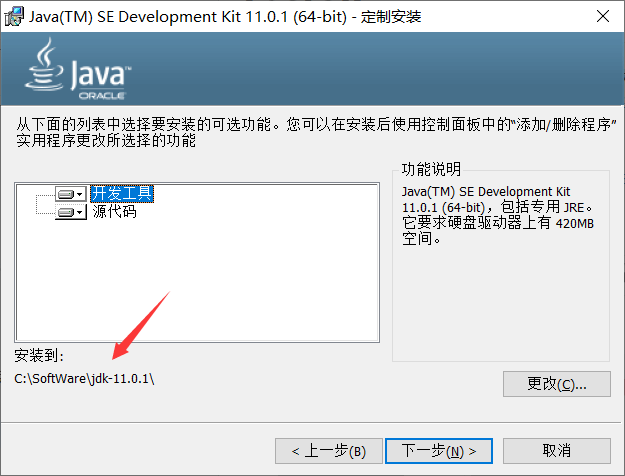
JDK Installation
Configuring Environment Variables
- Locate the JDK’s
bindirectory (e.g.,C:\Program Files\Java\jdk-11.0.1\bin) and copy the path.
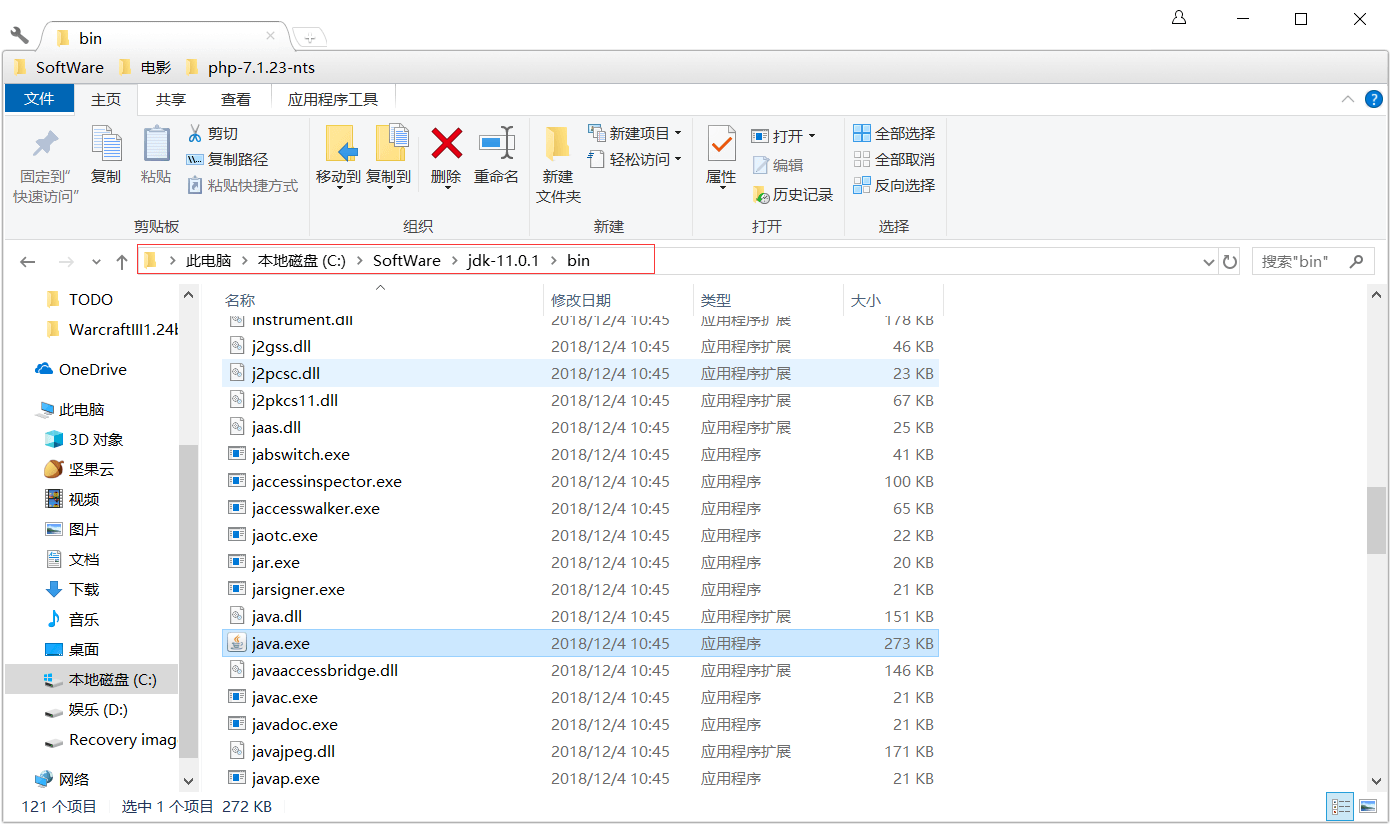
JDK Bin Path - Add to System Path:
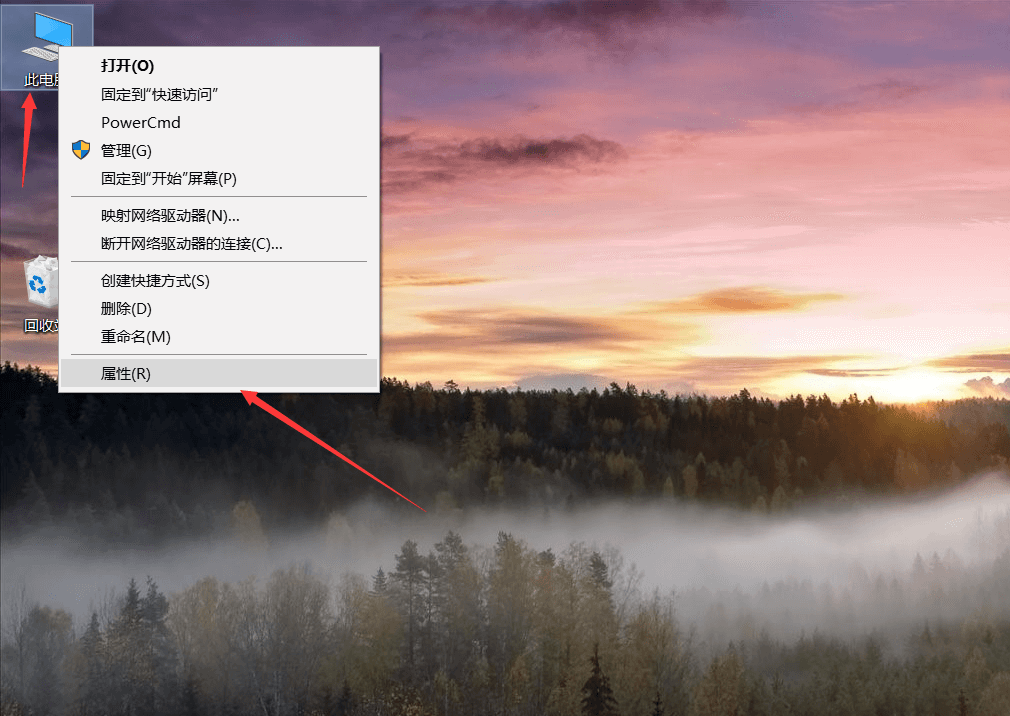
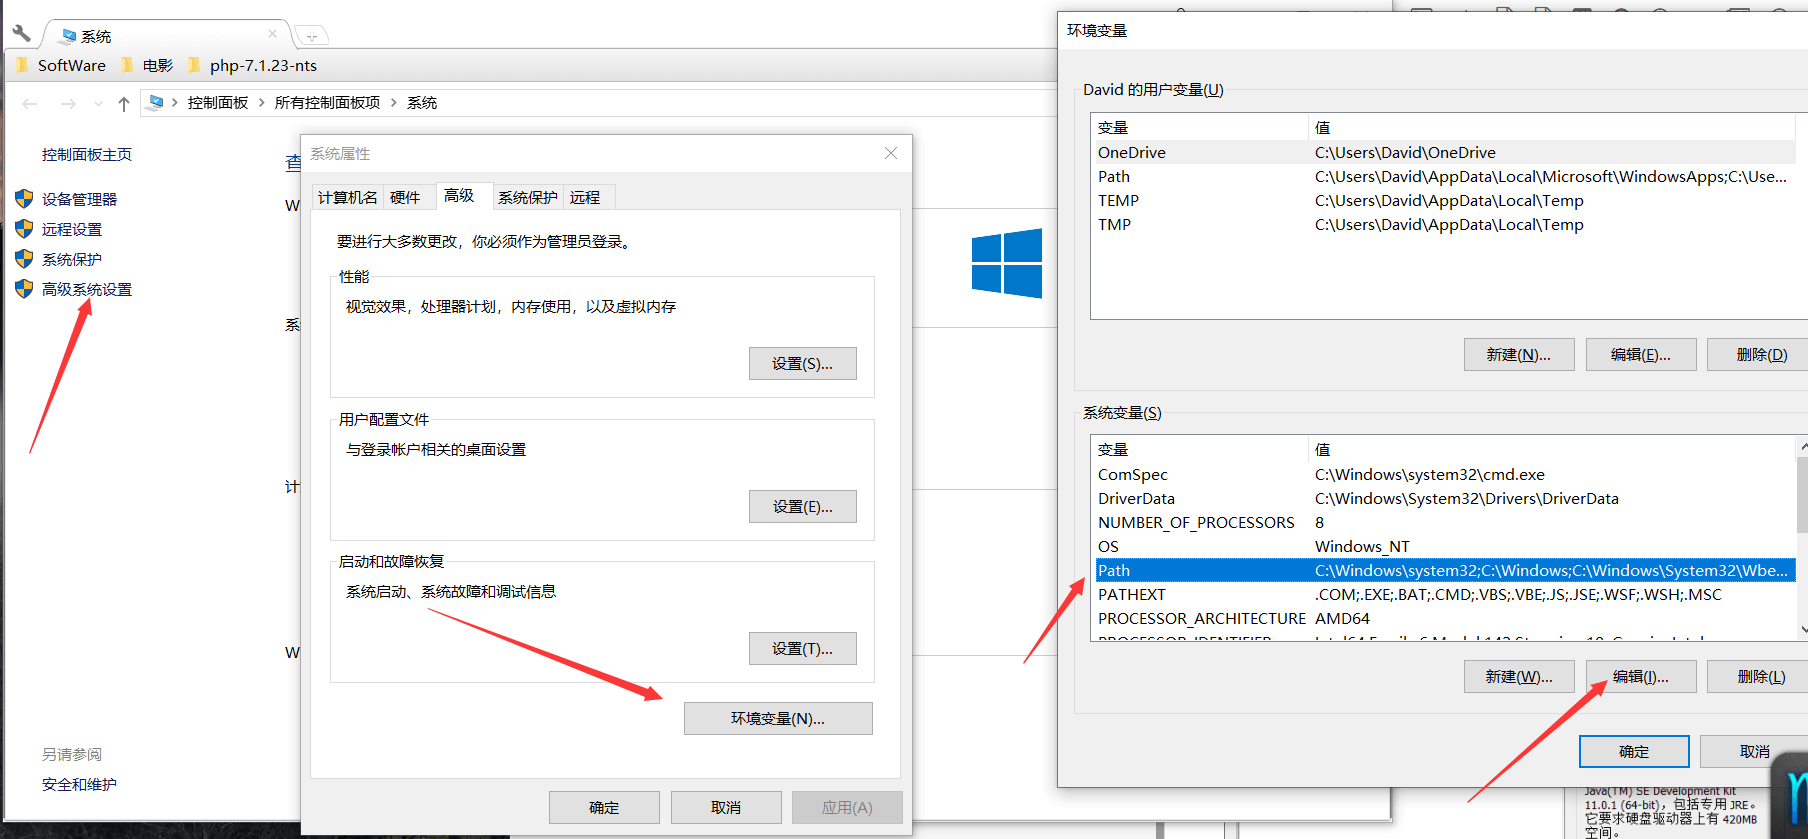
- Right-click Computer → Properties → Advanced system settings
- Environment Variables → Select Path → Edit
Environment Variables
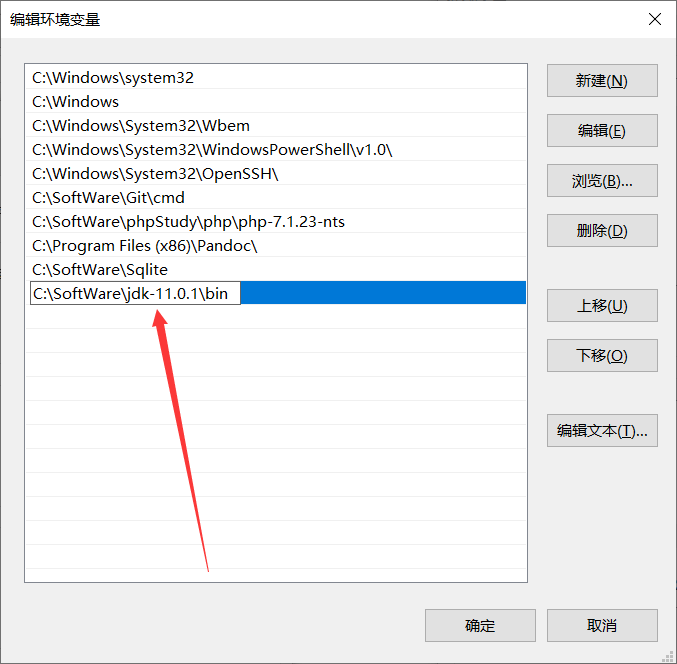
- Paste the JDK
binpath into the Path variable:
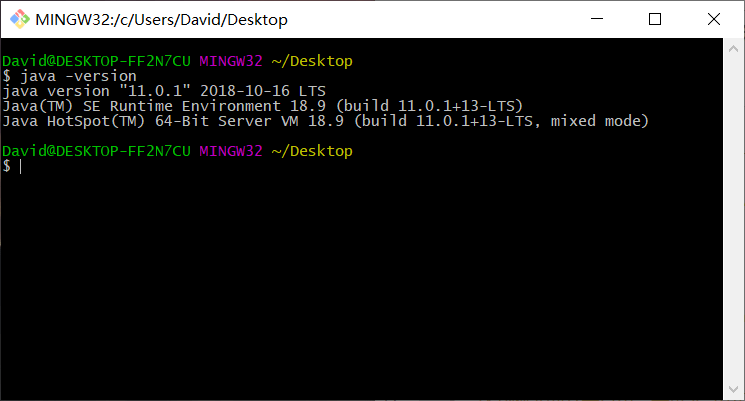
Path Configuration - Verify by running
java --versionin Command Prompt:
Java Version Check
Installing JMeter
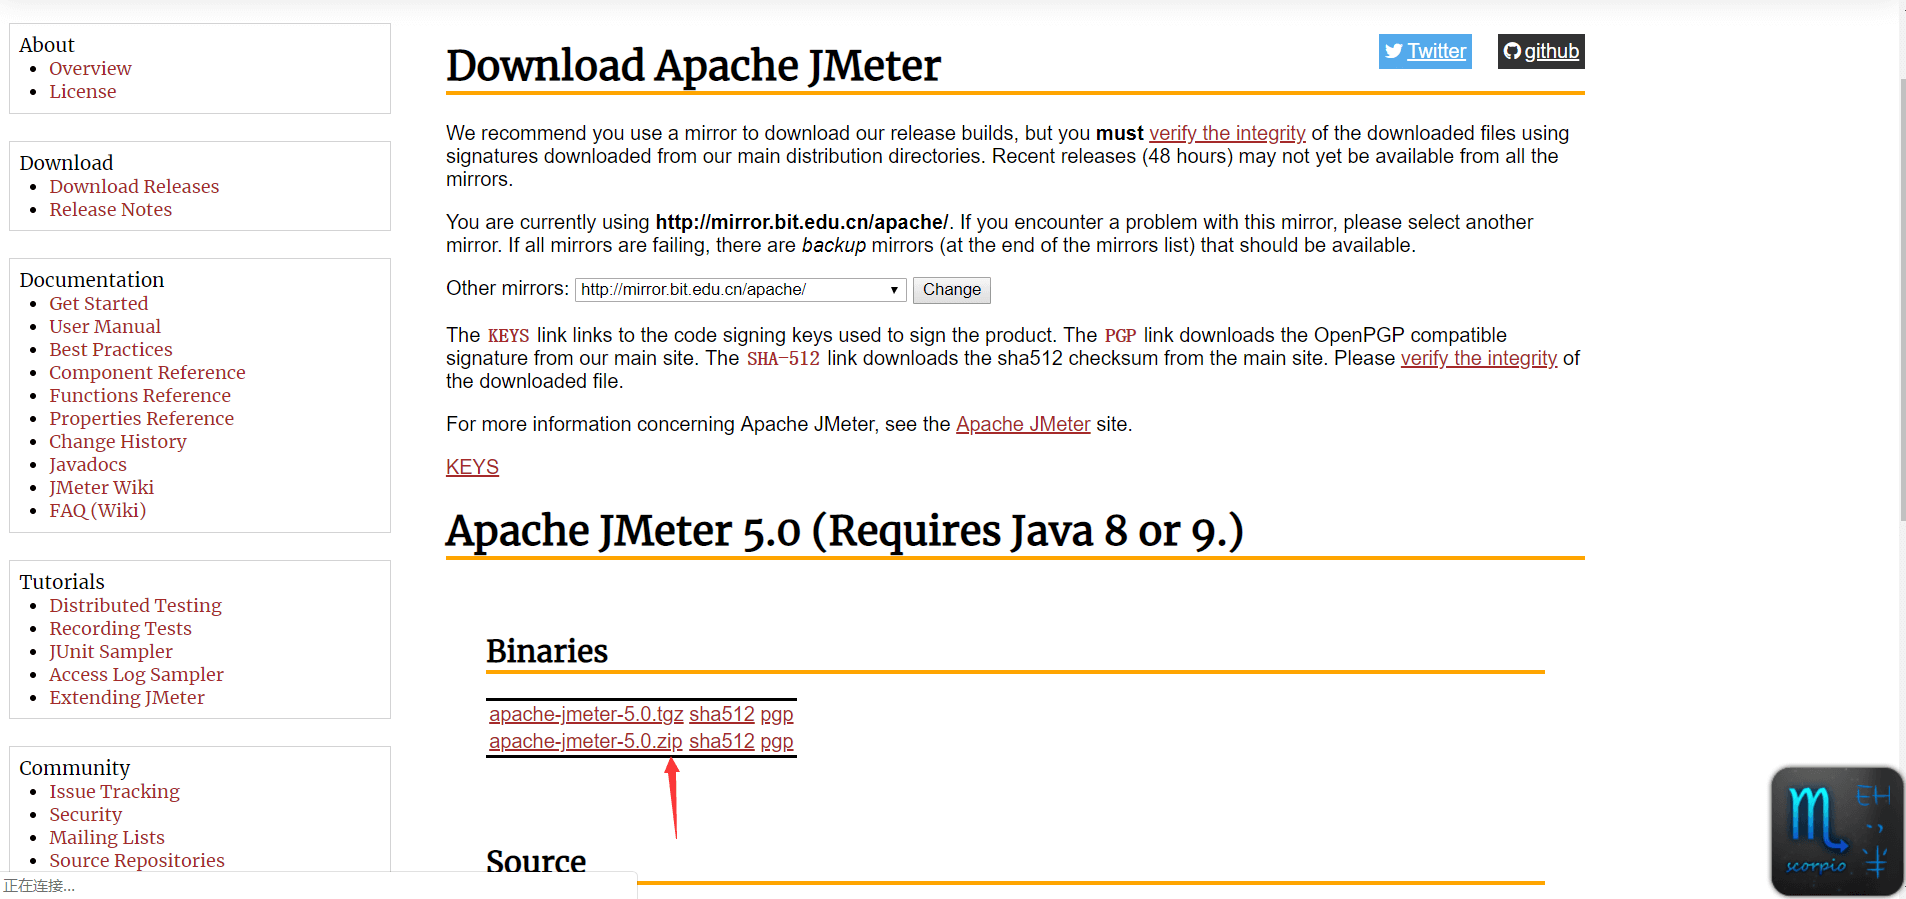
- Download JMeter from the official site:
http://jmeter.apache.org/download_jmeter.cgi
JMeter Download - Extract the ZIP file to your preferred directory (JMeter is portable).
- Launch JMeter by running
bin/jmeter.bat:
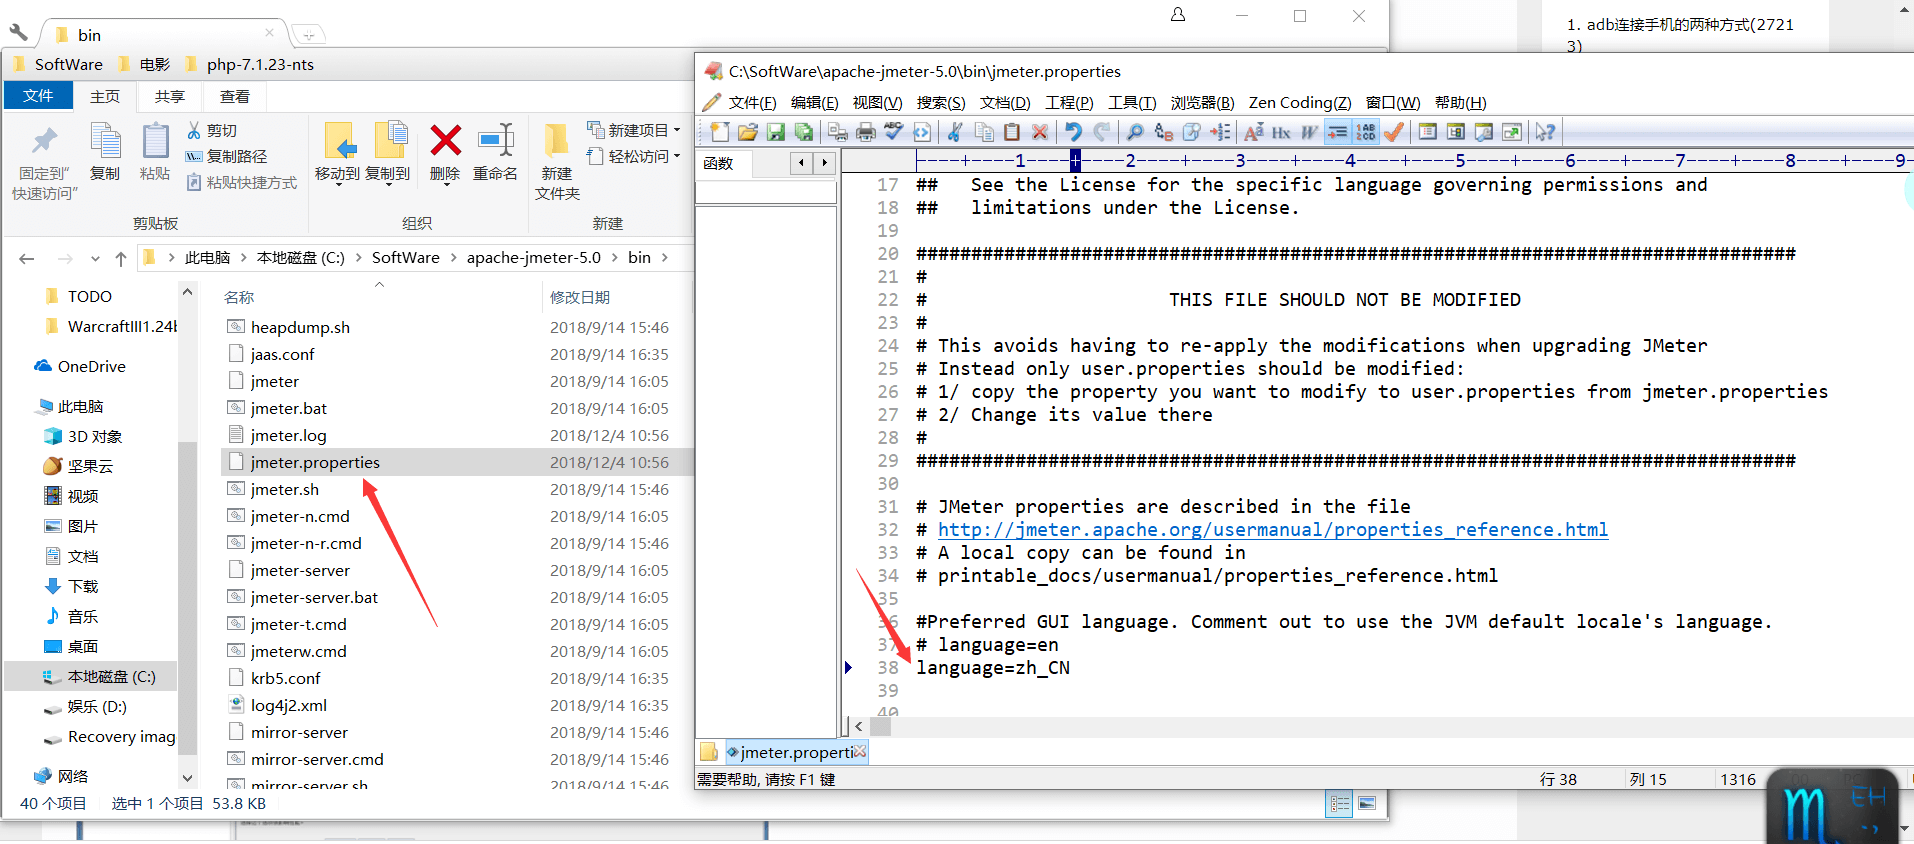
JMeter Launch - Set Chinese localization (optional) by editing
jmeter.properties:language=zh_CN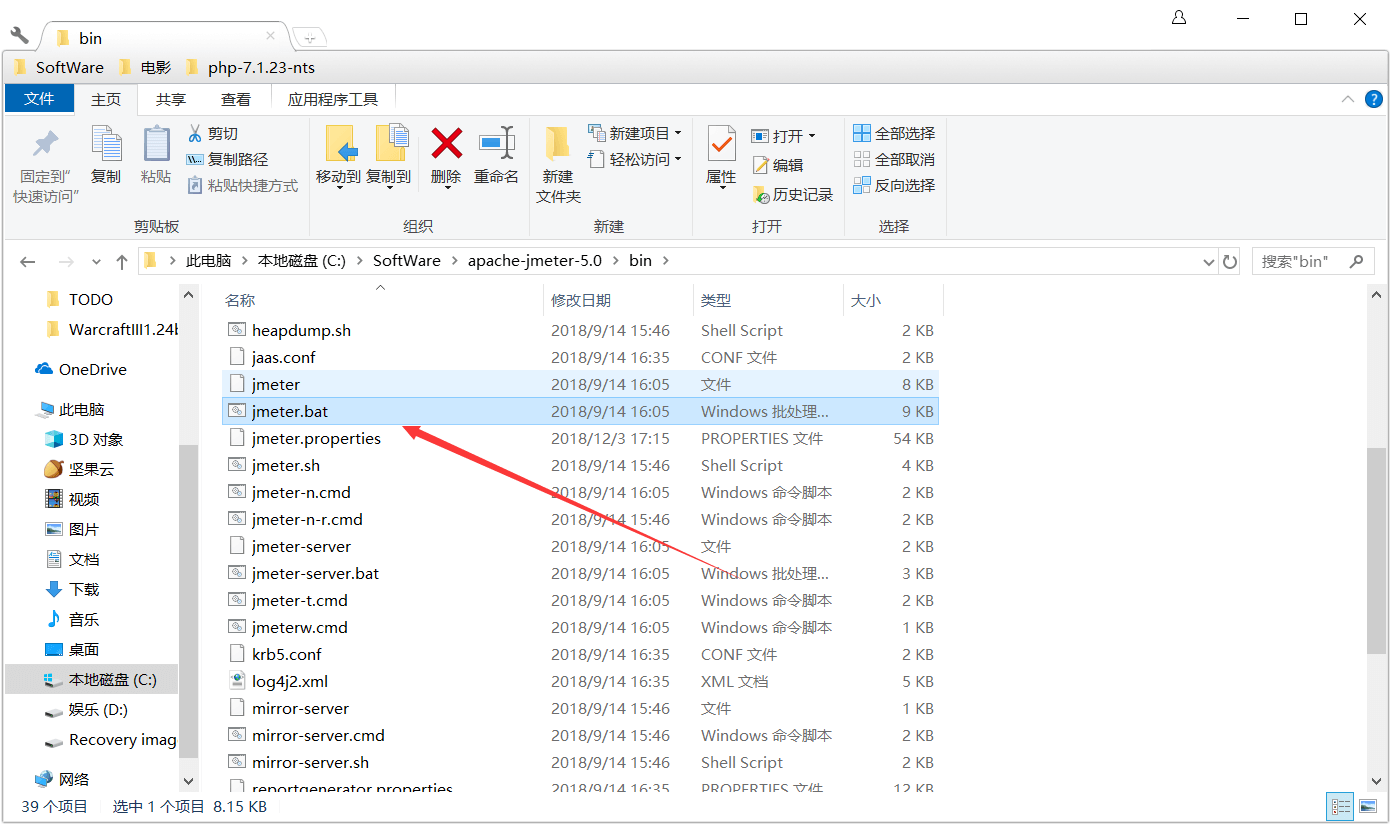
Localization Setting
Usage Guide
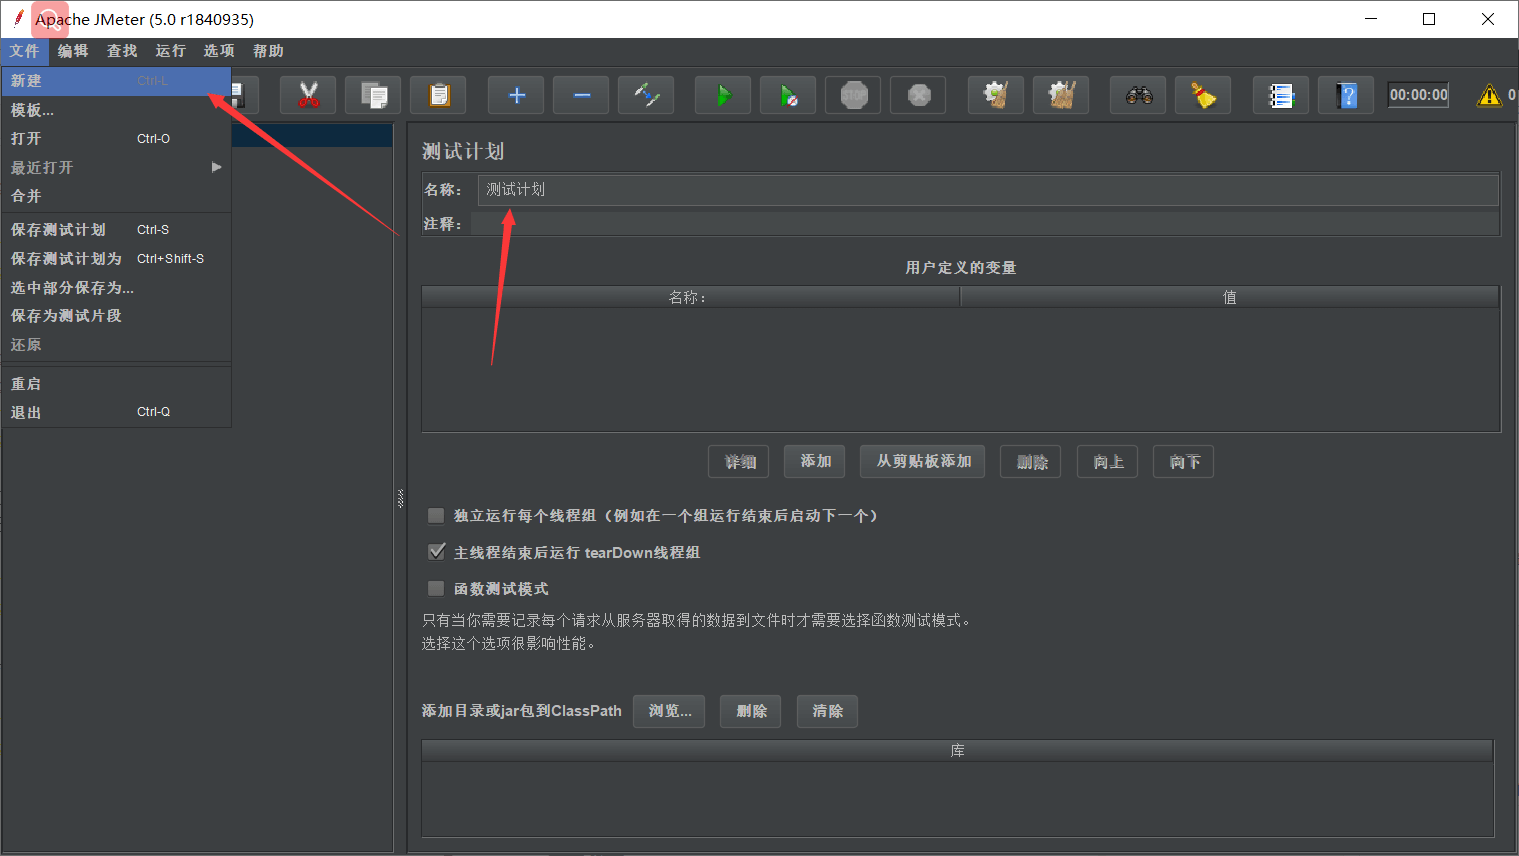
- Create a new test plan: File → New
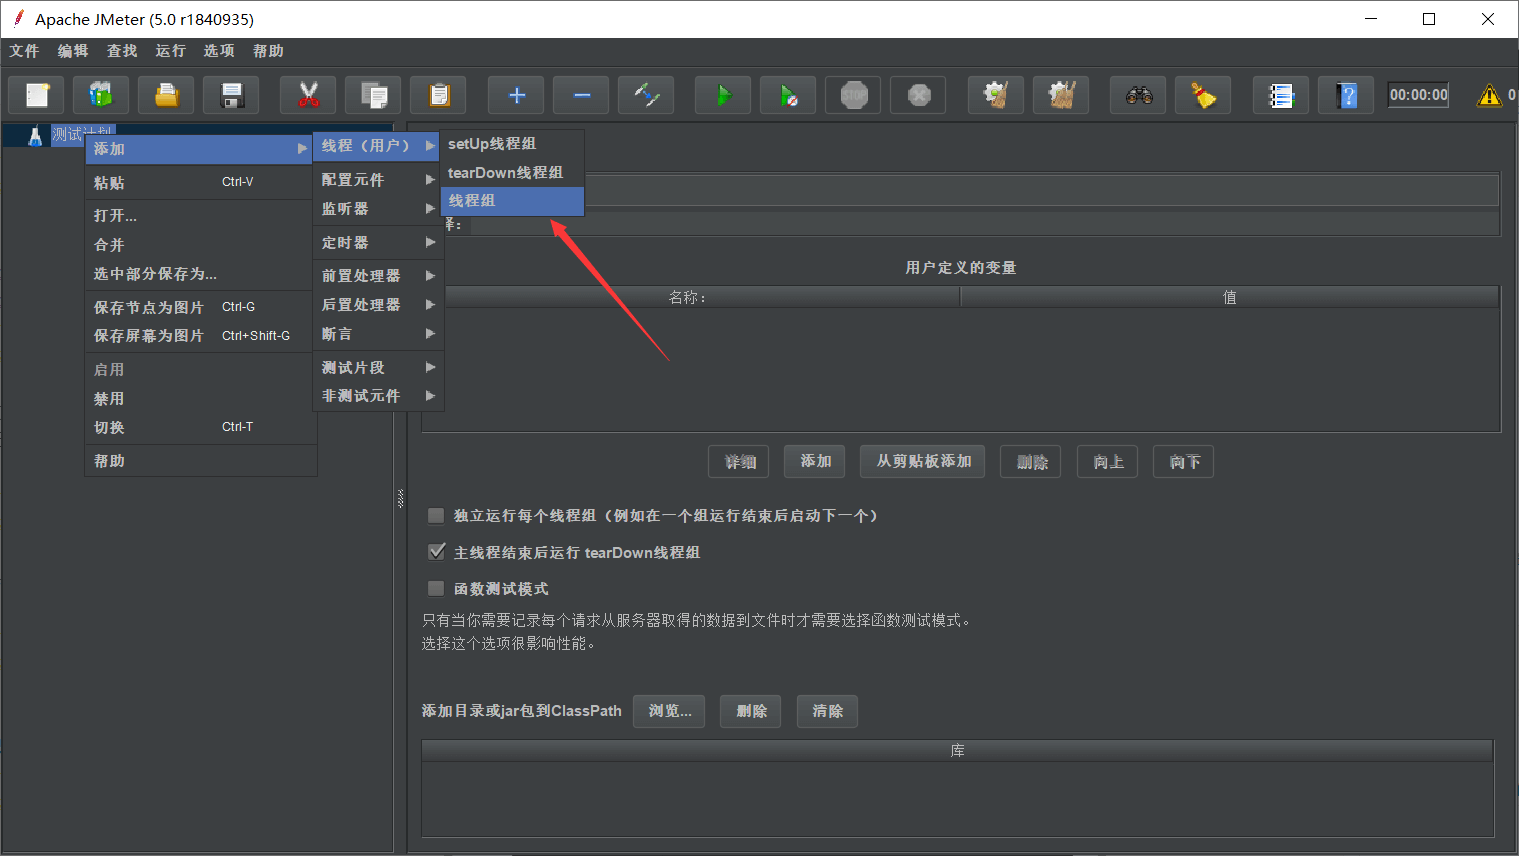
New Test Plan - Add a Thread Group:
- Right-click Test Plan → Add → Threads (Users) → Thread Group
Add Thread Group
- Right-click Test Plan → Add → Threads (Users) → Thread Group
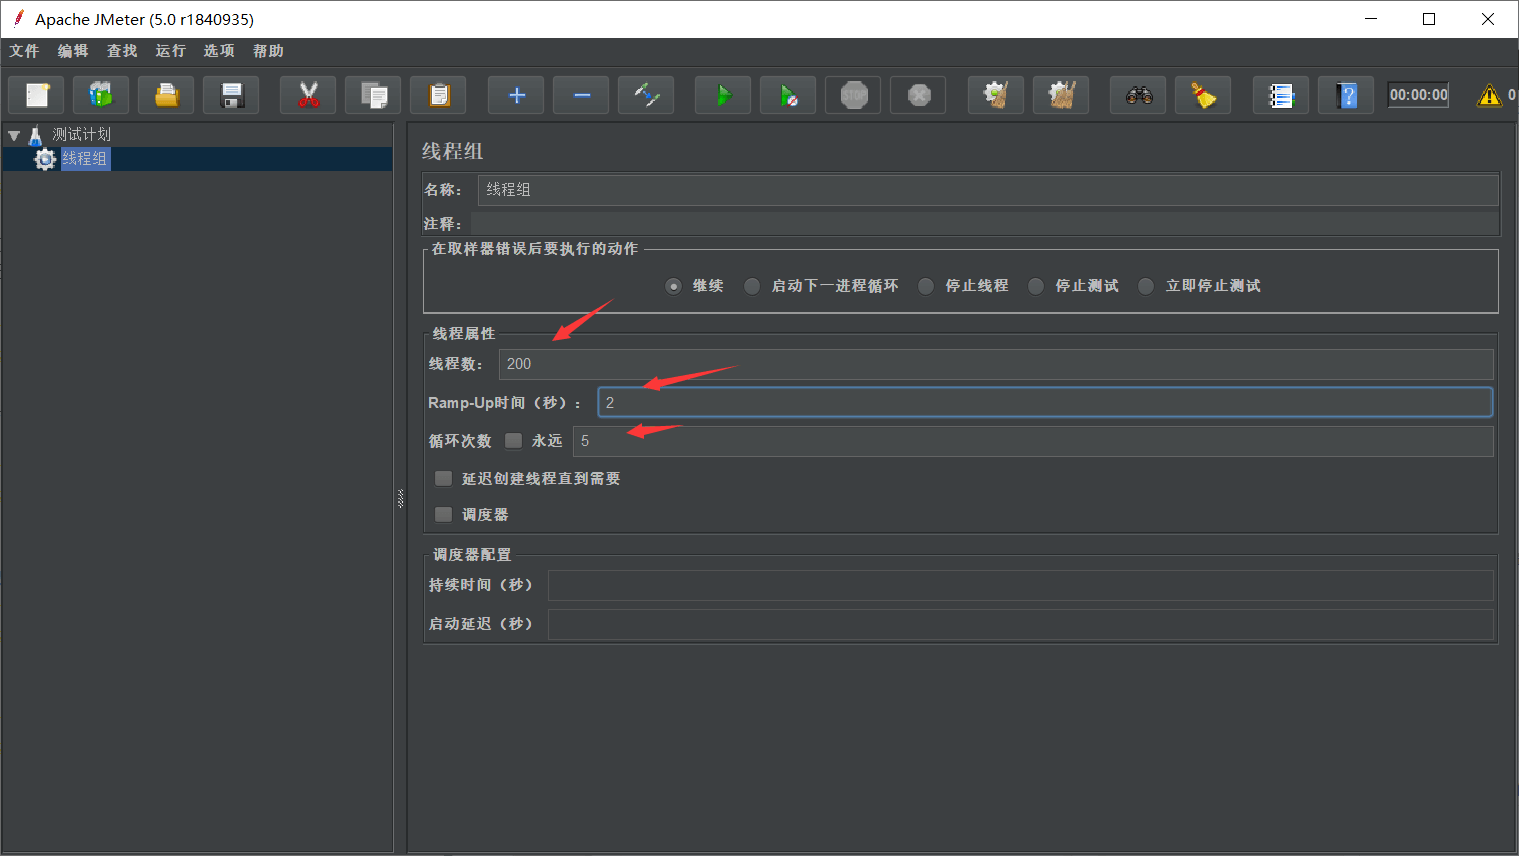
- Configure Thread Group:
- Number of Threads (users): 200 (concurrent users)
- Ramp-Up Period: 2 seconds (100 users per second)
- Loop Count: 5 (total requests = 200 × 5 = 1000)
Thread Group Settings
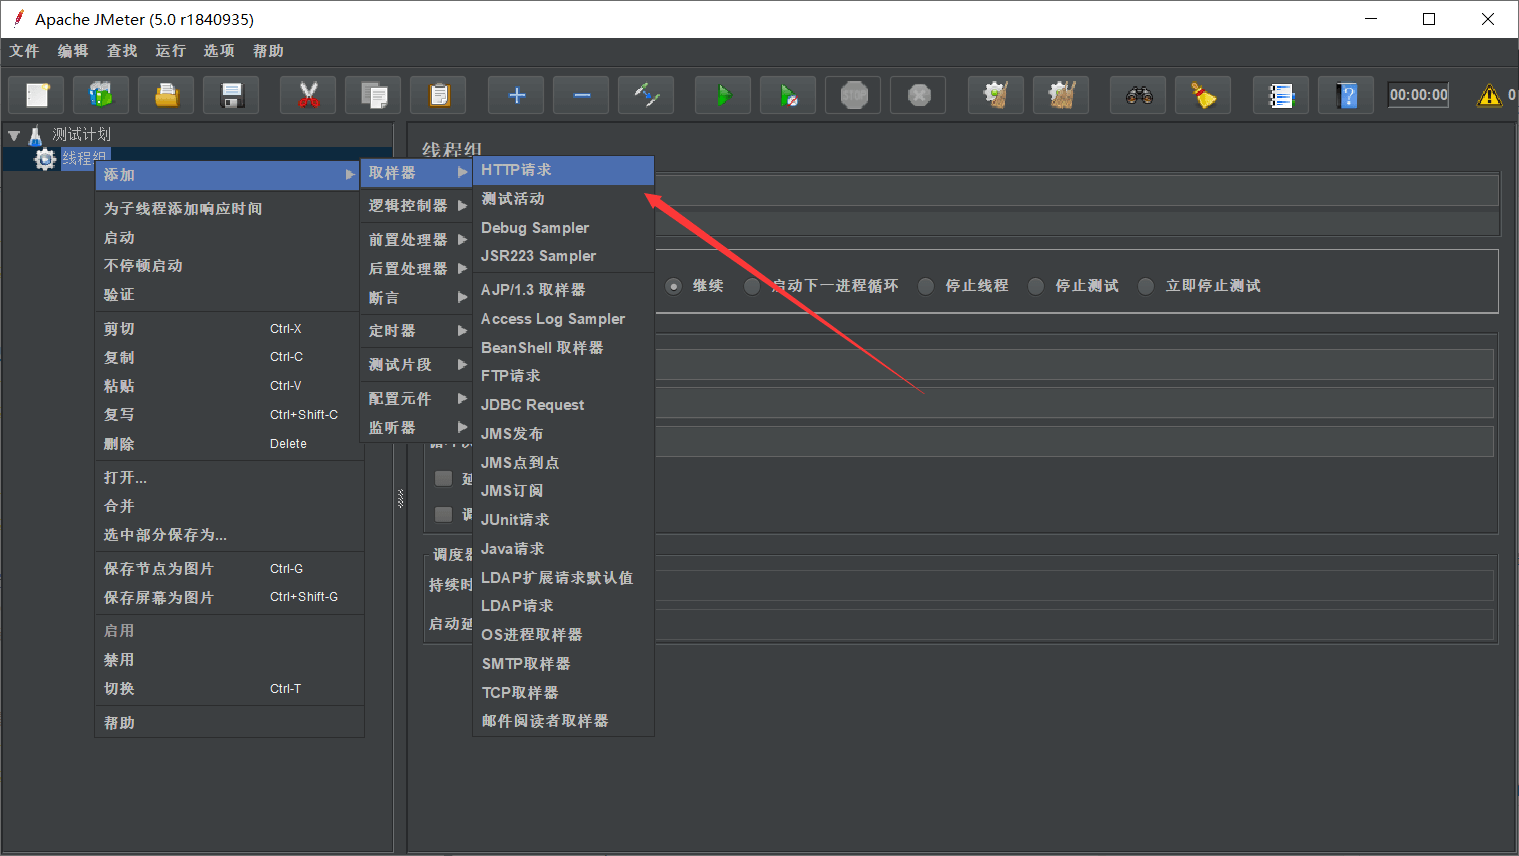
- Add an HTTP Request:
- Right-click Thread Group → Add → Sampler → HTTP Request
Add HTTP Request
- Right-click Thread Group → Add → Sampler → HTTP Request
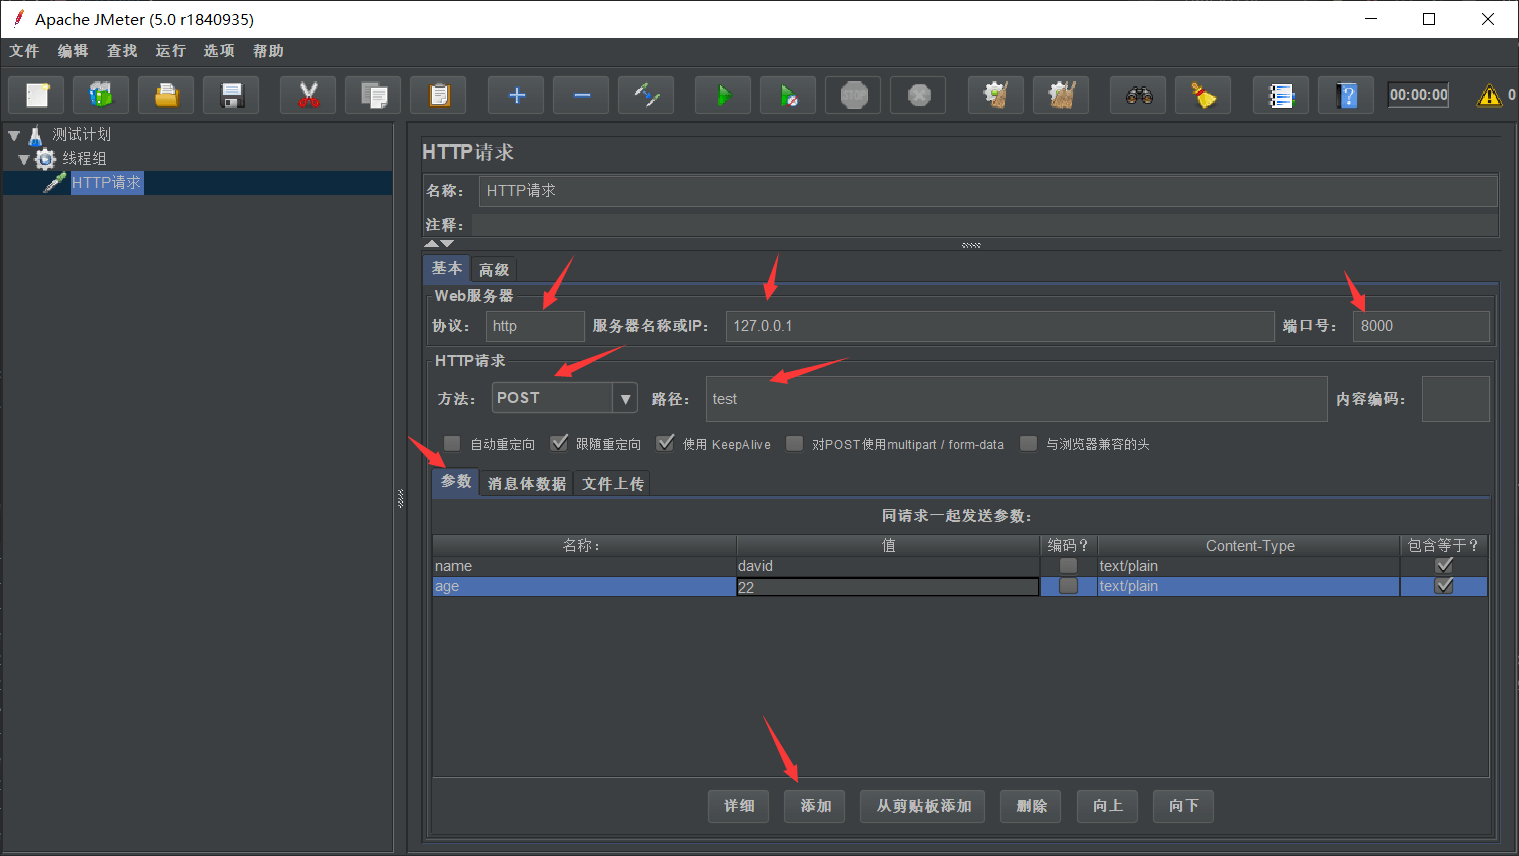
- Configure HTTP Request:
- Server Name/IP: example.com
- Path: /api/test
HTTP Request Settings
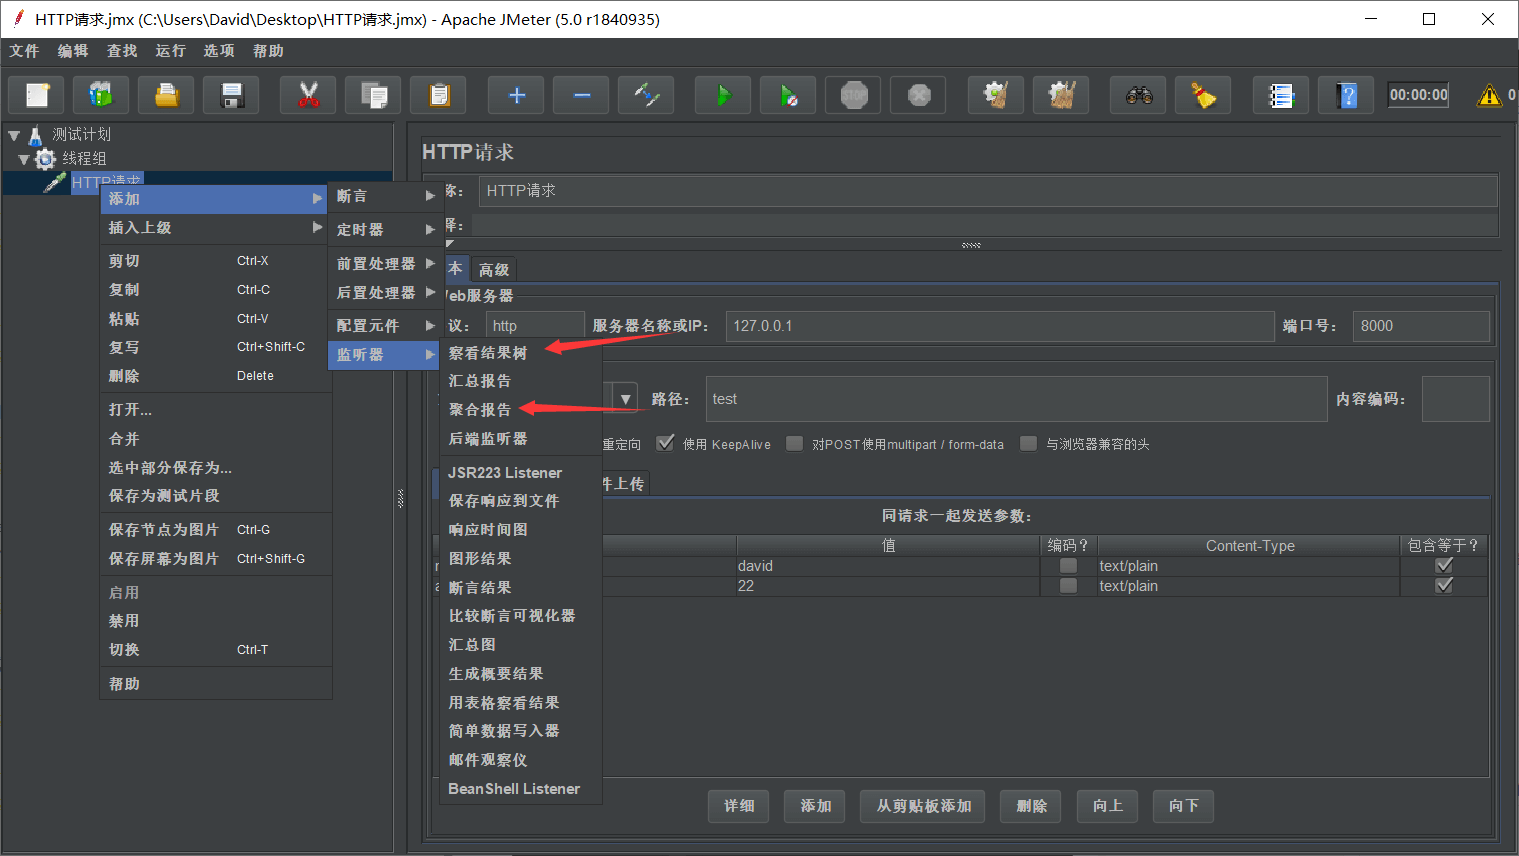
- Add listeners for results:
- View Results Tree
- Summary Report
Add Listeners
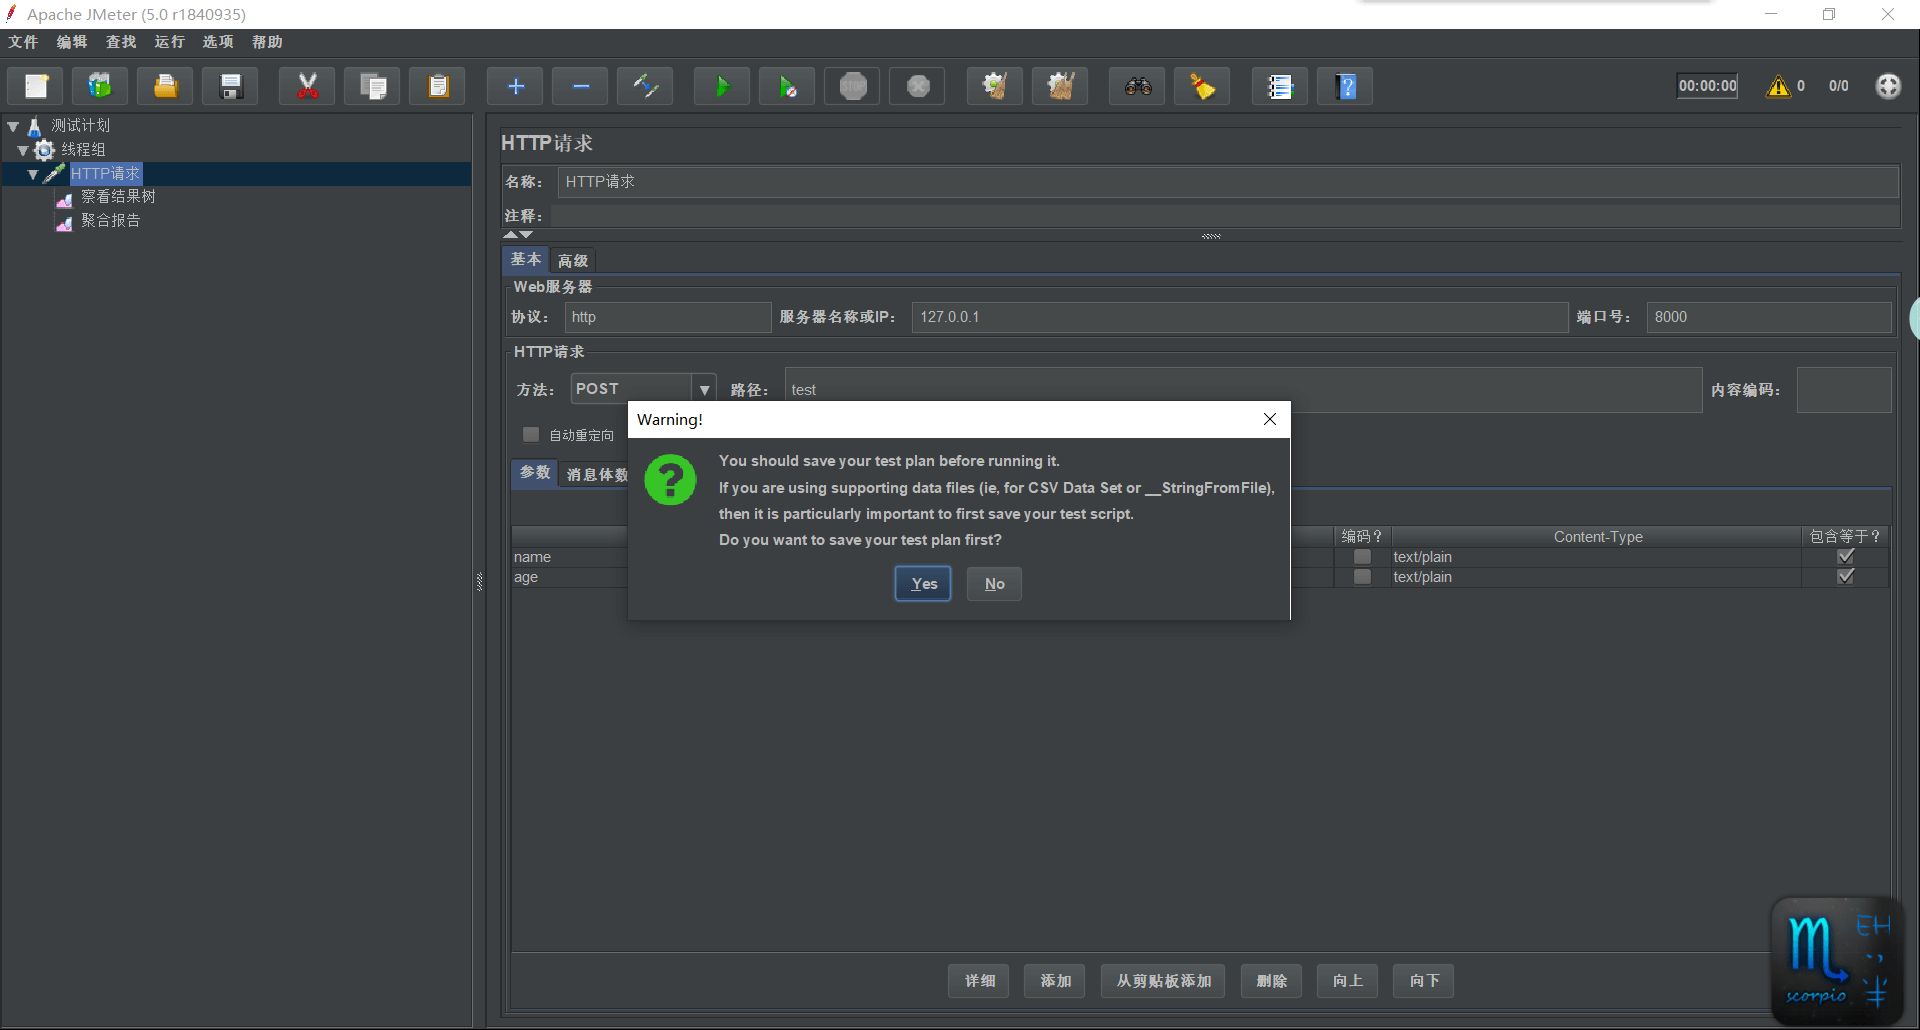
- Run the test (Run → Start) and save the test plan when prompted:
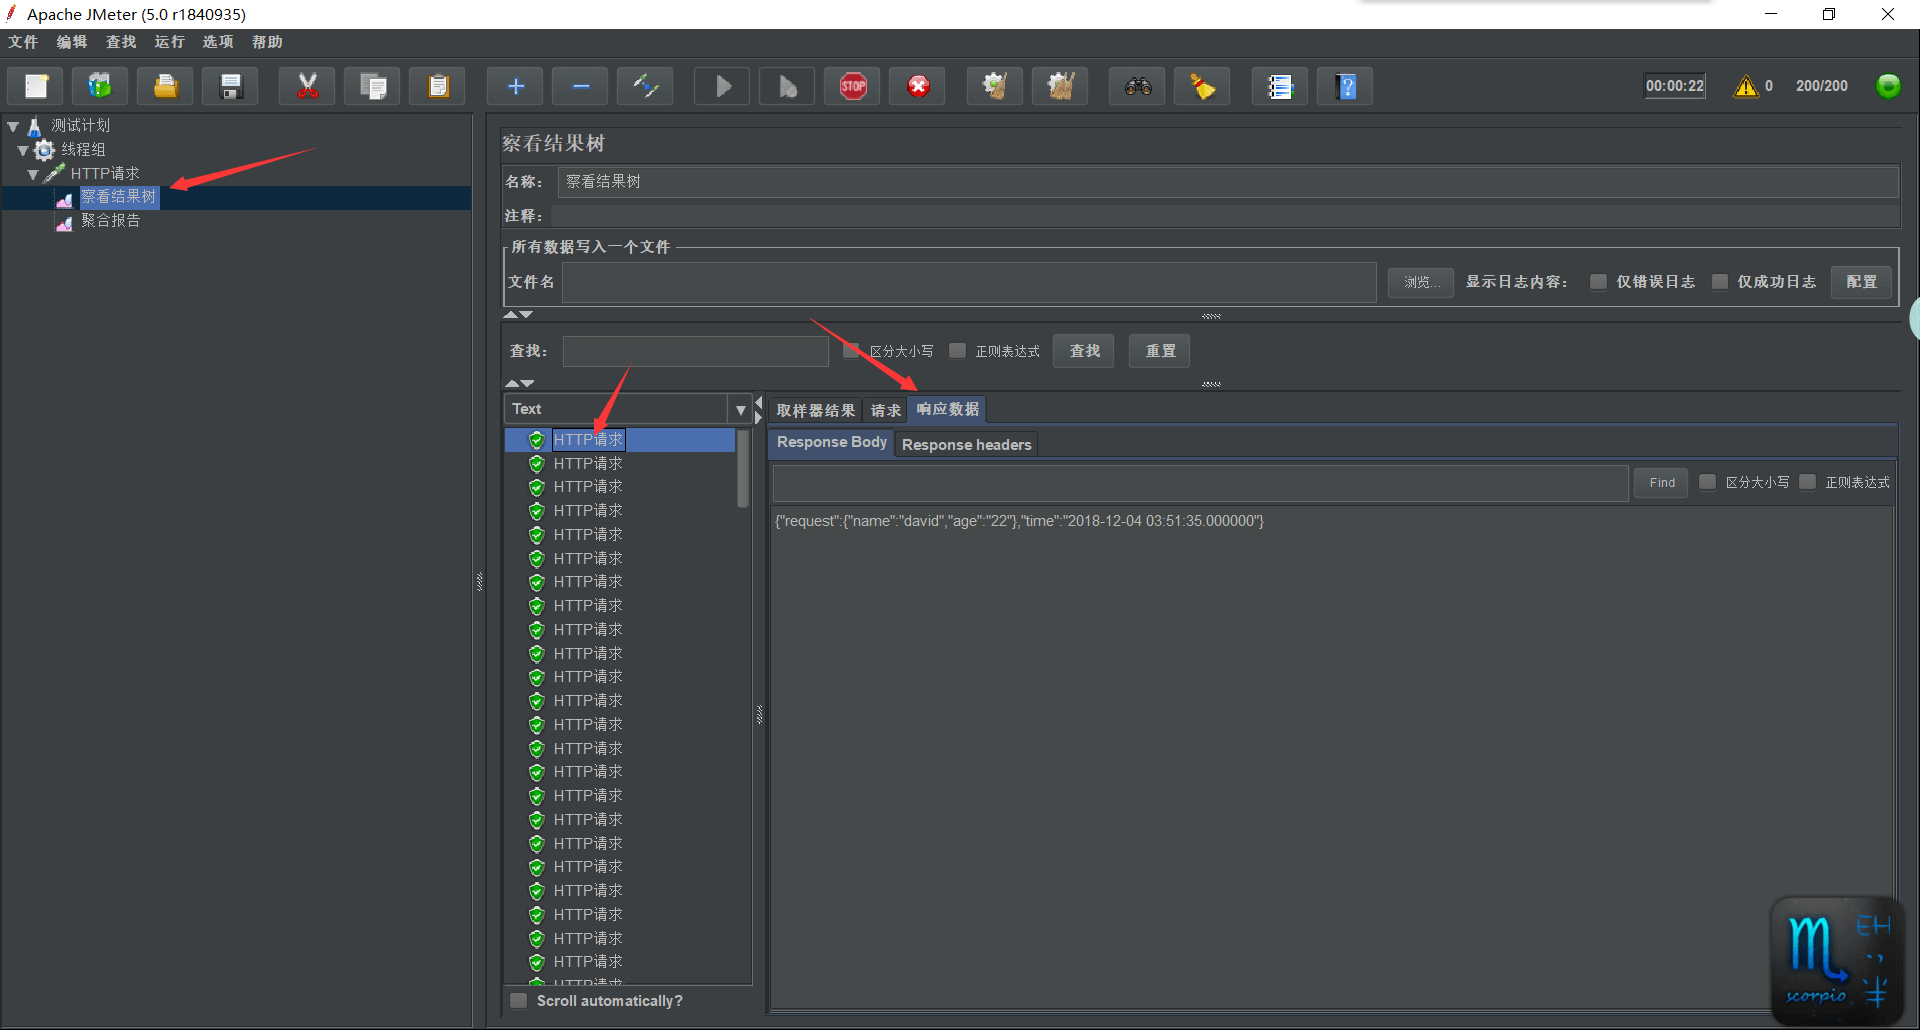
Run Test - View results in listeners:
Test Results
Aggregate Report
Aggregate Report Metrics Explained
| Metric | Description |
|---|---|
| Label | Name of the request (e.g., HTTP Request) |
| # Samples | Total requests sent to the server |
| Average | Average response time per request |
| Median | 50th percentile response time |
| 90% Line | 90th percentile response time |
| 95% Line | 95th percentile response time |
| 99% Line | 99th percentile response time |
| Min | Minimum response time |
| Max | Maximum response time |
| Error % | Error rate = (Failed requests / Total requests) × 100 |
| Throughput | Requests per second (RPS) |
| Received KB/sec | Data received per second from the server |
| Sent KB/sec | Data sent per second from the client |